08 Jan

Monthly income “for a normal life”

Since it seems like people enjoyed my last post about poverty, I thought I’d do a quick additional analysis. (By the way, ALL posts related to poverty are tagged for your easy browsing). And why do I, a scholar of technology do all this analysis of poverty? Because my research is actually about technology and inequality. And poverty is a very important topic to me. I wrote a paper a few years ago about the challenges of measuring poverty in the South Caucasus (I spent many months of my PhD dissertation tearing this issue apart. I’m still not satisfied with the ways of measuring this, but alas, other projects call to me.)

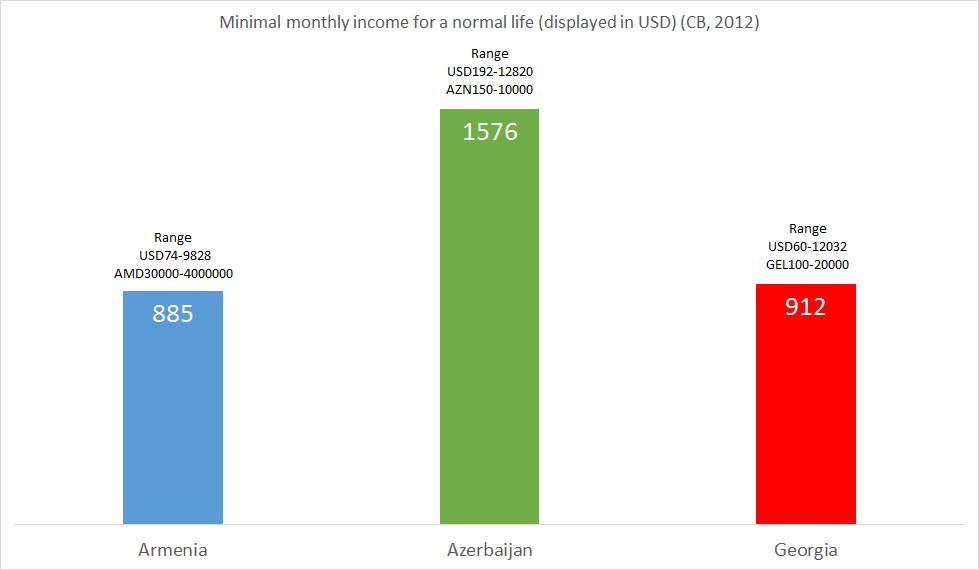
But here’s some interesting analysis – in the 2012 Armenians, Azerbaijanis, and Georgians were asked how much income would be required every month at minimum to live a normal life. They answered in their own currency, but this is converted to a consistent American dollar.

NORMALLIFE

Armenians and Georgians answered about the same (note the ranges in local currency though – I can imagine people answering a random round number), but Azerbaijanis felt that a household would need about USD1600 a month to live a normal life. Obviously I am a foreigner, but I can certainly attest that living in Baku, and consumer goods in Azerbaijan more generally, are much more expensive than in Armenia or Georgia. And apparently my own observations are not far off.

NORMALLIFEREGION

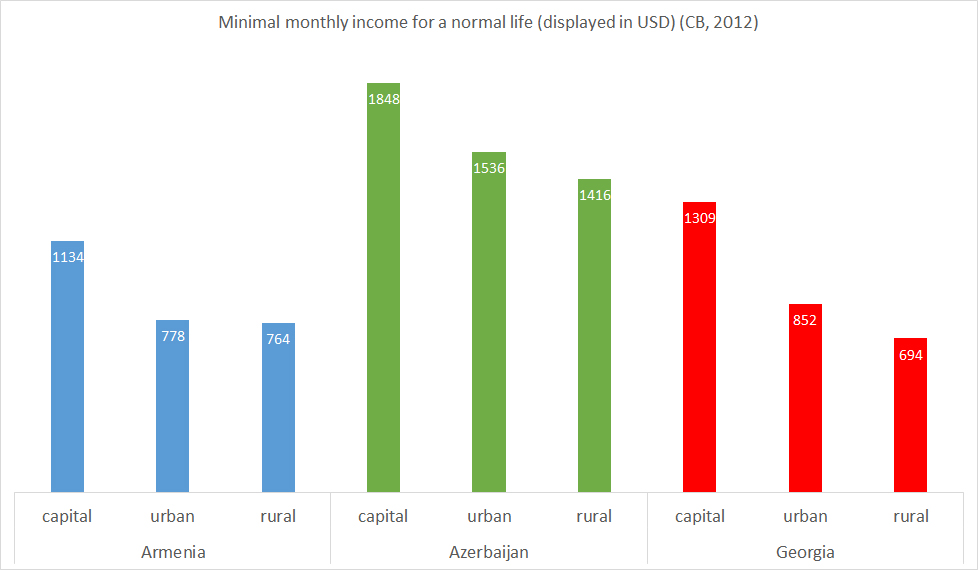
When broken down by region, Armenia and Georgia end up being pretty close again, with Tbilisi being slightly more expensive than Yerevan, in terms of what people think that need for a normal life.

AMDISTUSD

AMDIST

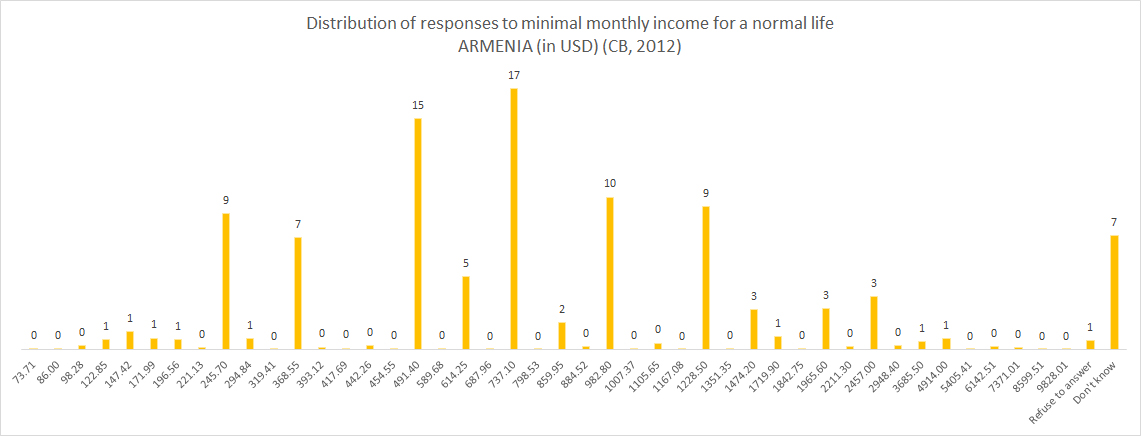
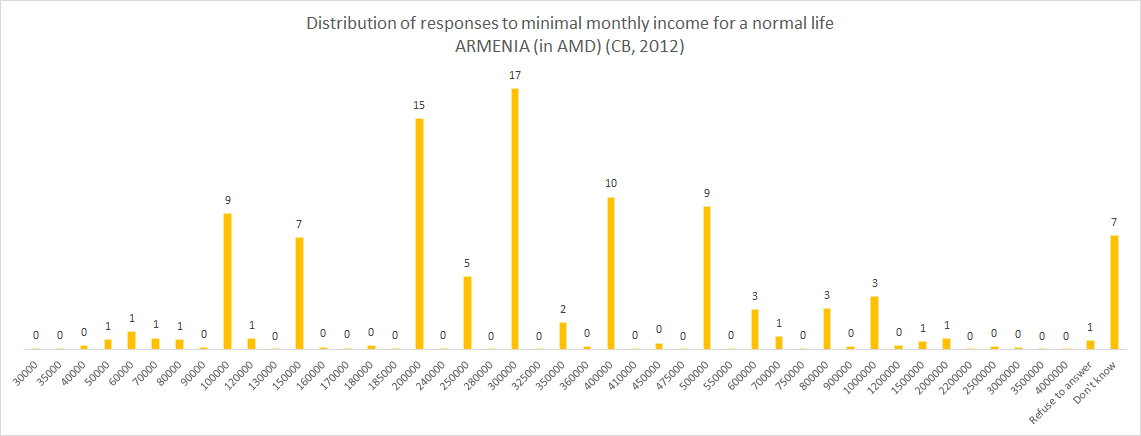
Looking at the distribution of Armenian answers, most people said 200000 or 300000 AMD (490 or 737 in USD).

AZDISTUSD

AZDIST

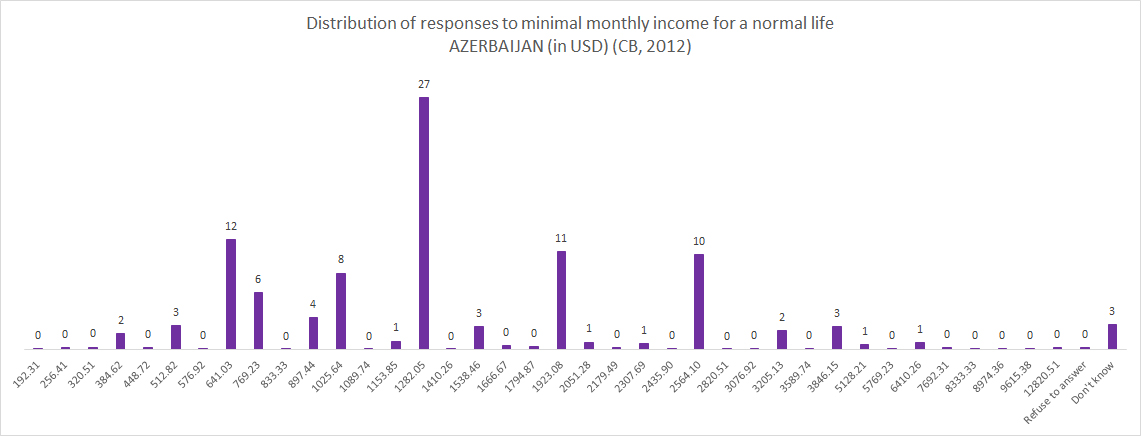
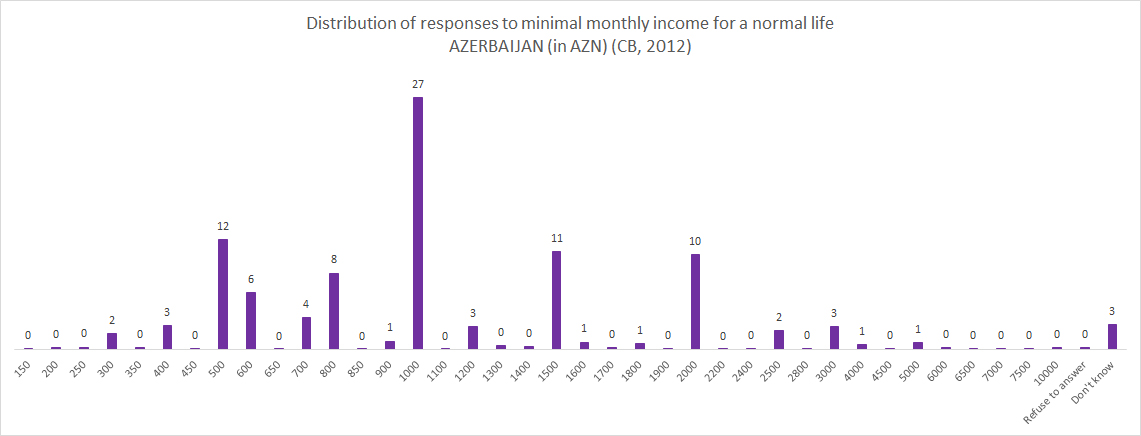
Most Azerbaijanis said 1000 AZN (1282 in USD).

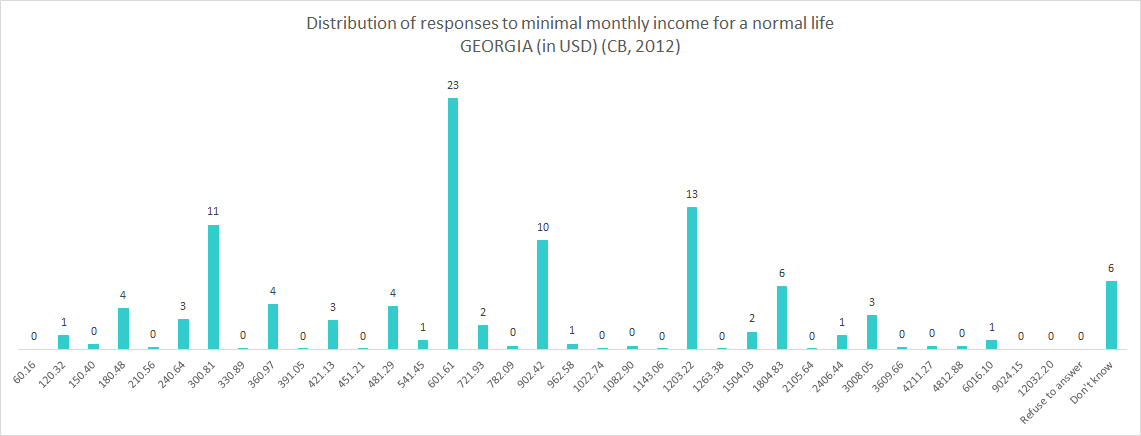
GEORGIADISTUSD

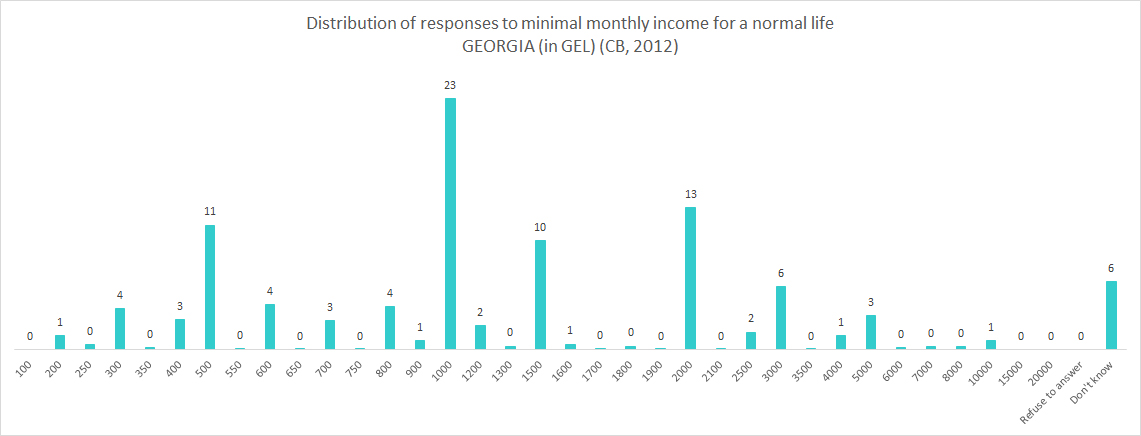
GEORGIADIS

For Georgians, most said 1000 GEL (602 USD).

This confirms that a lot of people are just picking a round number. But still, it is interesting to look at.

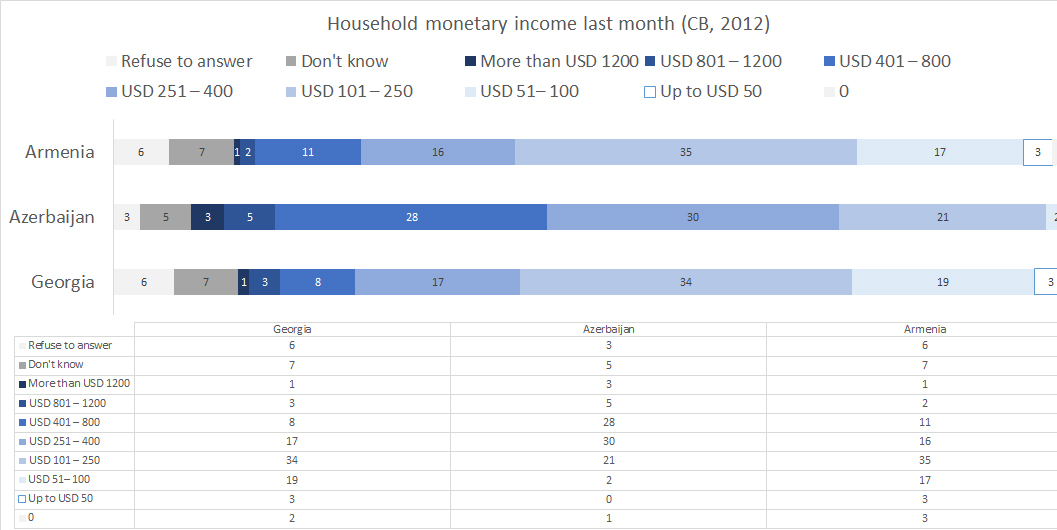
INCOMEDIST

Ironically, when looking at the actual household monthly monetary income, very few South Caucasians are actually making as much as they say they need for a normal life. So does this mean that people strongly feel that they need more? I would assume. Or perhaps there are additional sources of income – remittances, borrowing, credit, etc. that are not factored in here. If less than 3% of Armenians are making as much as they said they need for a normal life, what kind of lives are people leading?
30 Dec

Material Deprivation in 2012

A few years ago I wrote a piece about measuring poverty in the South Caucasus.

That paper ended with 2010, but I was talking about it with someone yesterday, so I did some quick 2012 updates.

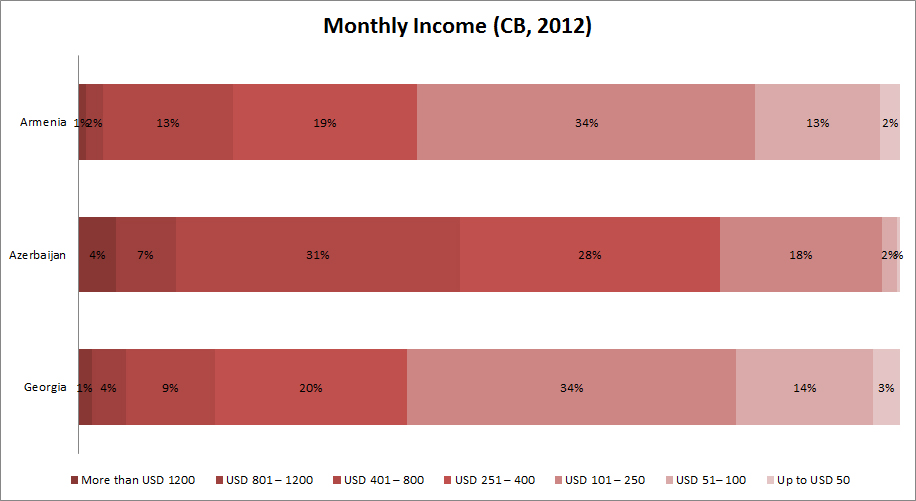
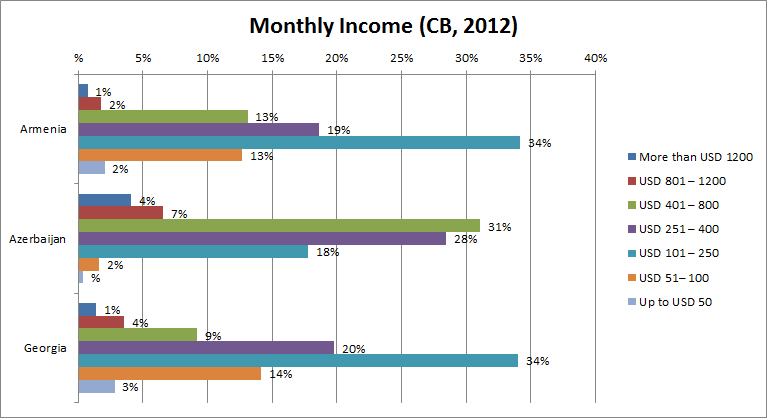
As far as monthly household income in 2012, the distribution hasn’t changed much since that 2010 paper, but you can see that Armenians and Azerbaijanis are doing much better economically.

income

income2

fig1

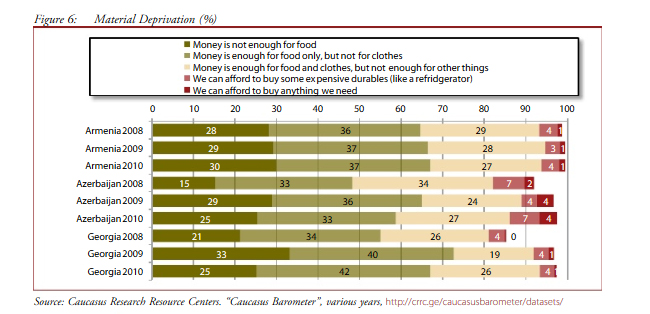
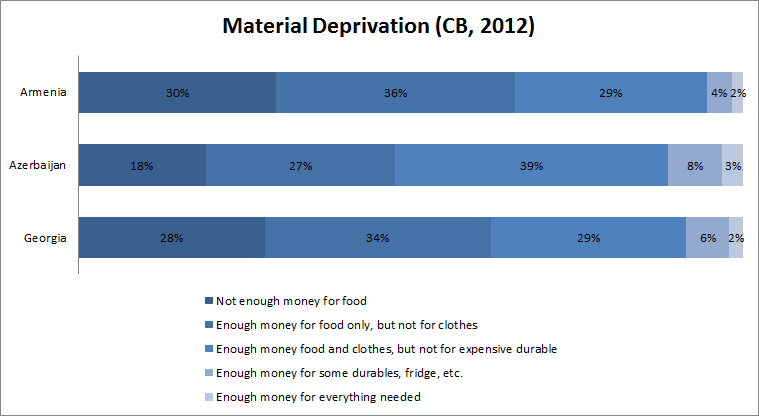
In the paper I argue that material deprivation is the best measure of economic wellbeing because it reflects household ability to buy consumer goods.

This is the 2009-2010 distribution of material deprivation:

mdold

And this is the 2012 update.

md

Armenia didn’t change much. Azerbaijan has less people at the poverty end of the scale, so that’s a positive change. Georgia had a bit of a change in more people in the enough for food category, but about the same in poorest category.


It is hard to see economic changes in such a short period of time – it would certainly be worthwhile to do some trend analysis here. Maybe next year!

25 Mar

The Story of Stuff

I’ve written before on consumption in the Caucasus, but here’s a 2012 update.

flickr

Any interesting ownership differences? Azerbaijanis like A/C, I guess.

flickr

No major differences here, but looks like Armenians love their phones!

flickr

People bought this stuff pretty recently.

I admit, this isn’t the most interesting analysis, but because it is so difficult to measure wealth in the Caucasus, I think looking at consumption habits is a good way to get a sense of how people are doing economically.

11 Aug

Summary of all economic wellbeing posts – Poverty in the Caucasus

Since I posted a lot of analyses on economic wellbeing in the Caucasus, I thought that I’d put links to them all in one post.

Overall, I hope that this gives people a better sense of what dire poverty exists in all three states. If pressed, I’d say that based on these analyses, Georgia is doing the worst overall and Azerbaijan is doing the best. But without a doubt, there are more similarities in poverty in these three neighbors than there are differences.

Consumption ability
Consumption ability by capital/urban/rural
New consumption 2012

Income sources
Income distribution

Ownership of consumer goods

Food expenses
Borrowing money to buy food

Utilities

Debt and savings

Sanitation

Please feel free to ask questions or requests for further analysis.

11 Aug

What are the sources of income in the Caucasus?

So where do people in Armenia, Azerbaijan, and Georgia get the money that they need to live?

For most households, the primary source of income comes from a paid salary (43% in Armenia, 44% in Azerbaijan, 32% in Georgia).

Another primary source of income for many families is a pension or other government benefit (23% in Armenia, 28% in Azerbaijan, and 30% in Georgia.)

Agricultural sales is another primary source (12% in Armenia, 12% in Azerbaijan, and 15% in Georgia).

But perhaps more interesting looking at total sources of money. Nearly 20% of Armenian families use money from relatives abroad to live on (11% of families use it as the PRIMARY source of income).

In all three countries, relatives help our other relatives that live in the same place (maybe a capital city relative helps village relatives?) (11% in Armenia, 8% in Azerbaijan, and 12% in Georgia).

But what is really interesting is that half of all families depend on some form of government assistance for money, although only a quarter or so say that it is their primary income.

In all three countries, salary and pension are the primary ways that people get money.

11 Aug

Not surprisingly, Yerevan, Baku, and Tbilisi residents wealthier

Regional differences are a big deal in the Caucasus. Thus, I did a comparison between capital city residents, those that live in regional cities, and rural villagers with the 2010 Caucasus Barometer.

In Armenia in 2010, people living in the capital have the most consumption ability (mean = 2.33), followed by regional cities (mean = 2.04), and the least able to consume are rural people (mean = 1.89).

In Azerbaijan in 2010, people living in the capital are the most able to consume (mean = 2.52), while people in regional cities (mean = 2.11) and rural (mean = 2.12) areas are no different in their consumption ability.

In Georgia in 2010, people living in the capital have the most consumption ability (mean = 2.29), followed by regional cities (mean = 2.11), and the least able to consume are rural people (mean = 1.97).

Comparing all three countries, the group that is able to consume the most is

1. AZ capital
2. AM capital
3. GE capital
4 (tie). AZ rural/ AZ urban / GE urban
5. AM urban
6 (tie). AM rural / GE rural

Thus, a rural Azerbaijani has more ability to buy things than a regional city Armenian or any Armenian or Georgian rural person.

11 Aug

Armenians, Azerbaijanis, and Georgians’ Food Expenses

Armenians, Azerbaijanis, and Georgians were asked to estimate what percentage of their income is used for food and utilities.

Overall, people in the Caucasus aren’t spending a lot on utilities.

Food, on the other hand, uses up quite a bit of a family’s income.

In all three countries, about half of all families spend more than 50% of their take home on food expenses.

As a comparison, Americans spend 5-6% of their income on food and Russians spend about 20% of their income on food.

11 Aug

Income Distribution in Armenia, Azerbaijan, and Georgia

So with all this poverty, how much money are Armenians, Azerbaijanis, and Georgians making?

In Armenia in 2010, the average monthly income was about $200 (mean = 4.74, SD = 1.28).
In Azerbaijan in 2010, the average monthly income was about $300 (mean = 4.17, SD = 1.28).
In Georgia in 2010, the average monthly income was about $150 (mean = 5.42, SD = 1.30).

Between 2009 and 2010, Armenia moved closer to a bell curve of income distribution. In 2009, the vast majority made less than $250 U.S.

In Azerbaijan as well, the distribution is moving closer to a larger middle class.

Georgia remains skewed towards the lower end of income distribution.

11 Aug

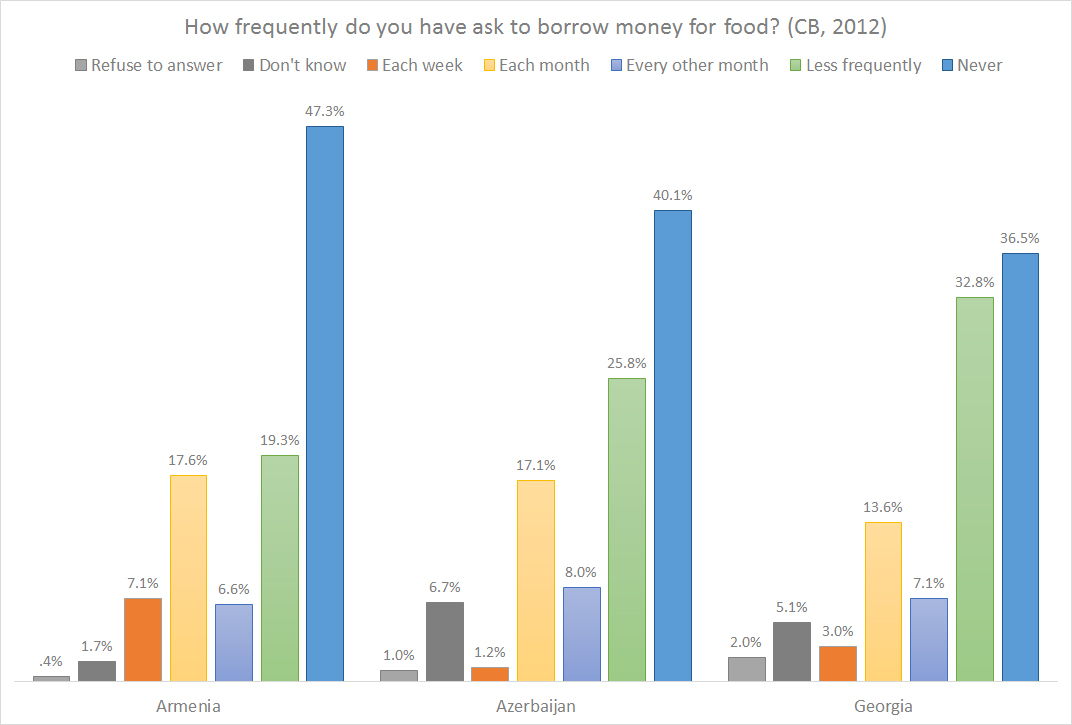
Many Armenian, Azerbaijani, and Georgian Households have to Borrow Money to Buy Food

With the high level of poverty, it is not surprising that many Armenians, Azerbaijanis, and Georgians borrow money to buy food.

In Armenia, the number of households that have to borrow money regularly has grown from 13% in 2007 to 31% in 2010. Nearly a third of all Armenian families borrow money MONTHLY to buy food. (And the percent of families that do not have to borrow money for food has remained constant.)

In Azerbaijan, things have remained relatively constant as well. Not very many families have to borrow money regularly, but about a quarter have to borrow occasionally. This raises concern about the overall poverty situation. Do Azerbaijani families have more trouble at particular times of the year? Are there times when a lot of money comes in or perhaps are they less inclined to have to borrow in the summer months when they can grow their own?

In Georgia, only about a third of households never borrow money for food and the percentages have remained stable over the four years, more or less. Like in Armenia, there are a large number of families that borrow monthly (about 20%) and like in Azerbaijan, there are a large number of families that have to borrow now-and-then (almost 30%).