13 Jan

Facebook in Armenia, Azerbaijan, and Georgia – 2013 – with a gender focus

While figuring out technology penetration rates isn’t my main interest, people do ask me a lot.

I get nervous about giving percentages because I am more interested in demographic divides – gender, wealth, education, region, etc. And for the most part, giving penetrations rates doesn’t allow for that. (See here for more on this.)

But a journalist was asking today about Facebook users in Azerbaijan and I learned about a new way to find out how many Facebook users are in a country — through Facebook’s Ad selling programs. While I don’t totally trust this information (numbers are too round, this counts ever used, not current or regular users), it is interesting. ETA: But the numbers they give  are not exact, so these percentages displayed below are not accurate for the true number of users. I calculated everything from the actual population. So when it says 36% of Georgian women are X, I calculated from the population data from the World Bank. This isn’t SOLID information, but it does come FROM Facebook, so it is a little bit better than SocialBakers.

This is what it looks like to find out this information:

facebook

So, Armenia has 2,974,184 people, Azerbaijan 9,590,159 people, and Georgia 4,555,911 people total according to the World Bank and after I subtracted those age 0-14 (World Bank’s category, not mine) the populations are Armenia: 2,460,436; Azerbaijan: 7,419,487; Georgia: 3,855,233.

Facebook Ads says that this many people in each of those countries is a potential viewer of their ads (thus a Facebook user): Armenia: 580,000; Azerbaijan: 1,320,000; Georgia: 1,220,000 (for those that think this is a competition, Georgia is “winning”). Let us acknowledge that these numbers from Facebook are way too round, thus they are rough estimates. We can’t trust them completely. But let’s see what we have.

Thus, here are the percentages of the age 14+ populations of each country who are on Facebook:

a

Armenia: 24%
Azerbaijan: 18%
Georgia: 32%

So that is interesting, but let us look at gender differences (I took the direct gender population data from the age distribution tables – this is not 50/50, but more accurate).

b

Armenians and Georgians are evenly distributed gender-wise on Facebook. And Azerbaijanis, well, this gender difference isn’t surprising.

c

In terms of the balance of users, Armenians are fairly even, Georgians have about 10% more women and you can see that about 2/3rds of Azerbaijanis on Facebook are men. Although this may seem shocking, this is much better than it has been in previous years.

A category that the World Bank uses is ages 15-24 and we know that 18% of Armenians and Azerbaijanis and 14% of Georgians are in that age range – I again used the raw numbers from the World Bank to calculate these.

Armenia Azerbaijan Georgia
ages 15-24 280000 780000 540000
male 15-24 136000 500000 260000
% to pop 0.50332 0.552317 0.795326
female 15-24 134000 280000 280000
% to pop 0.524821 0.329551 0.905431

d

EDIT: THIS SHOULD BE 15-24 YEAR OLDS!

Wow Georgia! Most Georgian young adults are on Facebook, no doubt about that. About half of Armenian young adults and for Azerbaijan 55% of male young adults and a third of female young adults.

I also looked at the 13-18 year old users on Facebook, but I can’t compare them to the total population of 13-18 year old males and females in these states because I don’t have the data from the WorldBank. But here are the raw numbers and the ratio of male to female.

Armenia Azerbaijan Georgia
ages 13-18 124000 300000 240000
male 13-18 62000 190000 114000
female 13-18 62000 112000 124000
male/female 1 1.696429 0.919355

And here are the raw numbers for 18+, which I can’t analyze by age category because I don’t have the WorldBank data to compare, and the ratio of male to female.

Armenia Azerbaijan Georgia
ages 18+ 480000 1140000 106000
male 18+ 240000 740000 480000
female 18+ 240000 420000 560000
male/female 1 1.761905 0.857143

Those ratios in Azerbaijan are notable.

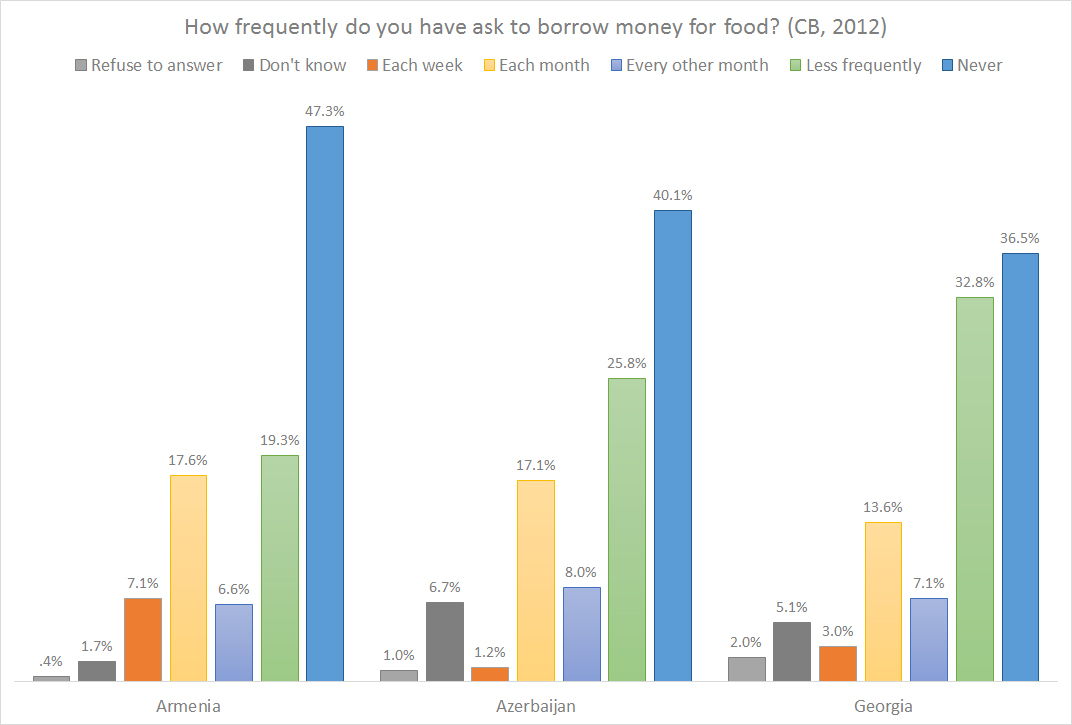
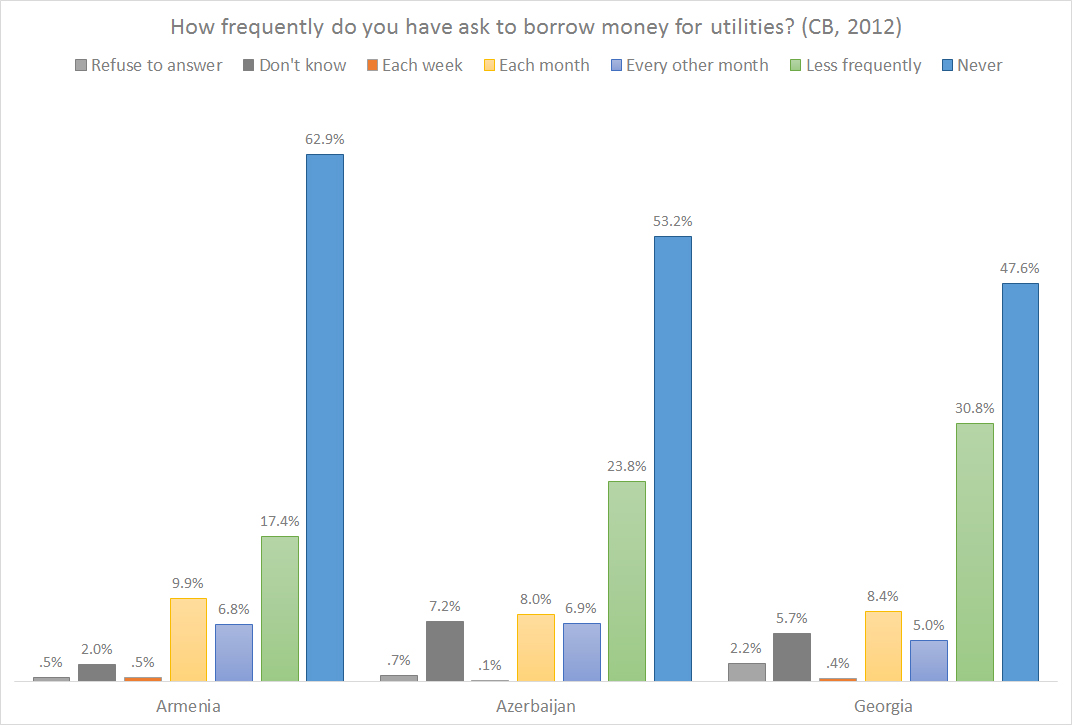
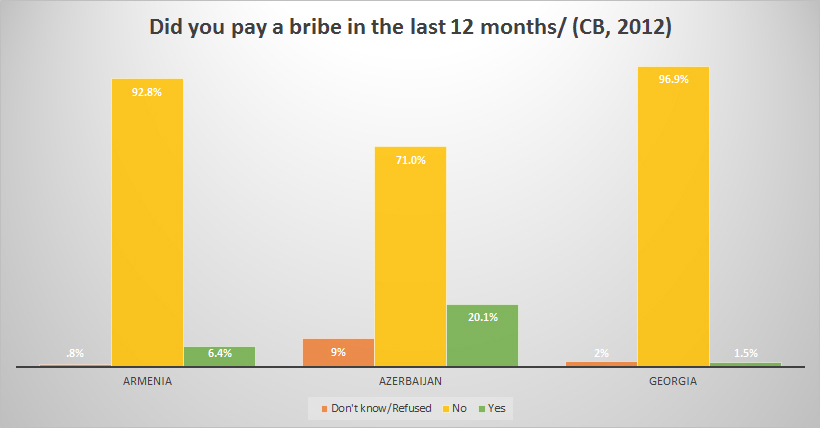
For comparison, here’s Caucasus Barometer derived information from 2012.

11 Jan

A response to Breaking the News: The Role of State-Run Media

Christopher Walker, the executive director of the National Endowment for Democracy (NED) and Bob Orttung, an associate professor of international affairs at George Washington University’s Elliott School of International Affairs have an article in this month’s Journal of Democracy, and an accompanying Washington Post article and upcoming event.

I like both of them a lot, and I wanted to write a blog post response to their article because it really got me thinking. I thought it was a nice piece that summarized the current state of authoritarian run media. I had just a few critiques.

As for the article itself, Christopher and Bob’s aim seems to be to describe how authoritarian state-run media functions today given that state-security apparatus don’t work in the same way and that coercion alone isn’t enough to maintain control. In some ways this is not dissimilar from some of the arguments that William Dobson makes in the Dictator’s Learning Curve. Authoritarian leaders have to be much more wily today than in the past. (They do cite Dobson.) Dobson argues that because the Cold War and Soviet sponsorship ended, the democracy promotion business exists, and the Internet/technology is allowing for new ways for information to spread, that authoritarian regimes are being more creative.

Christopher and Bob argue that authoritarian regimes are finding new ways to use media to stay in power. Specifically, without the strong backbone of something like the Communist Party, the media fills a void – as they say, a mix of consumerism, nationalism, anti-Americanism, and other intellectual currents to keep the regime popular as well as discrete alternatives to the regime to marginalize opposition. Moreover, because opposition groups don’t have access to mainstream media, they have trouble accessing the public anyway.

In a forthcoming article in Demokratizatsiya (coincidentally edited by Bob Orttung), I use Schatz’s “soft authoritarian tool kit” to understand Internet control in Azerbaijan. Schatz’s framework seeks to provide an understanding of the way that the state interacts with its people in order to maintain control. First, an authoritarian regime boasts that it has extensive support. Second, it controls non-supporters through material enticements. Third, those not influenced by material considerations face, blackmail, harassment and coercion. Fourth, the regime carefully controls information flows while allowing the opposition limited access to media that generally reach small audiences. And fifth, the regime employs discursive preemption, staging political drama to undermine opponents’ ability to grow support.

As I read the Journal of Democracy piece, I desperately wanted to use this framework in these cases too, especially the fourth and fifth tools. I think that it is a useful way to think about WHY the authoritarian regimes do certain things. It is easy for those of us that think about authoritarianism every day to assume these things, but I wish that this had been brought into this Journal of Democracy piece more as it would likely be useful for those new to these ideas.

Another point in the piece is that there are four audiences. I really like this framework. 1) The regime’s own elites 2) the populace at large 3) the country’s internet users and 4) opposition and civil society.

This really spoke to me.

1. Wtih the regime’s own elites, this makes a lot of sense. I often read state-media reports and I think to myself, this is for their own people. Specifically, in Azerbaijan, which is a patronage-based political system, Guliyev and Radnitz argue, the biggest threat to the ruling regime comes from within. And using the most recently presidential elections as an example, Guliyev and I argued that the performative or spectacle allows the regime to show their control.

2. The populace at large is an obvious audience of course, as keeping people as “zombies” and out of politics through promoting the good work of the regime and demonizing the opposition. The article points out that rural and poor citizens are both the base of authoritarian support and also those most likely to be reached by state-run media. I often debate people about this, but I think that more research needs to be done on this. We’re assuming a lot.

3. The control of the Internet is, obviously, the topic that I am most interested in. Christopher and Bob rightly note that the Internet needs to be approached differently that mainstream media and that regimes are struggling with figuring out how to best do this. The authors do not come down firmly on the cyberutopian side of the potential of the Internet debate, but they are certainly more on that side of things. I argue that in Azerbaijan, the regime also looks to the Internet as another place to humiliate the opposition (see my forthcoming Demokratizatsiya pieces). This is again a place where I think that Schatz’s framework would have been helpful in their arguments. I do appreciate that Christopher and Bob noted that the Internet isn’t yet large enough to pose a challenge to TV and it is such a cacophony it isn’t a unified opposition platform.

4. Opposition and civil society audience are important too. Certainly we must acknowledge that this is not a single body or mind, but without a doubt authoritarian regimes use media to send messages to these groups. In this article though, the focus is more about denying access and not so much about the actual messaging. Where are the “Hahahaha, opposition. We are going to mess with you.” type news stories that I see regularly?

A key missing point for me, beyond the Schatz’s framework, was, as Egorov, Guriev, and Sonin argue, authoritarian regimes tolerate some opposition press to provides the government with insight into what its citizens are saying and check in on bureaucrats. And I don’t see that within this Journal of Democracy piece. How does that fit in to the control?

ETA: In Azerbaijan the government also does a lot to suppress the opposition printed press. Through libel suits, fines for selling newspapers, pressures on printing presses, etc., the opposition press is really weak. In the last few months, the two opposition print papers have nearly collapsed.

—-
Also a little bit about this publication. The Journal of Democracy is an interesting publication because it is not a traditional academic journal. It is housed within NED’s International Forum for Democratic Studies, although it is published by Johns Hopkins University Press. But most importantly, articles in the Journal of Democracy are not subject to peer review. As I understand it, many of the articles in this journal are commissioned. All of this makes it quite different from traditional academic journals. (Although according to Google Scholar, it is the 10th top publication in Political Science – but its h5-index is lower than the top four journals in Communication). This is not to say that the articles are not good – they are often thoughtful and interesting and are more frequently from practioners rather than scholars (although certainly scholars do publish in it.) It seems to me that some scholars use this journal as a platform for launching a new big idea. (If you look at the most cited articles, they are quite interesting thoughtpieces from some big names ). Regardless, I think that it is important to understand the context of this publication.

10 Jan

Beyonce… In Love

beyonce

People that know me personally know that I LOVE Beyonce a lot.

When the new album came out, I listened to it and watched the videos (while in Baku) over and over and over again. It is weeks later and I still listen at least once a day.

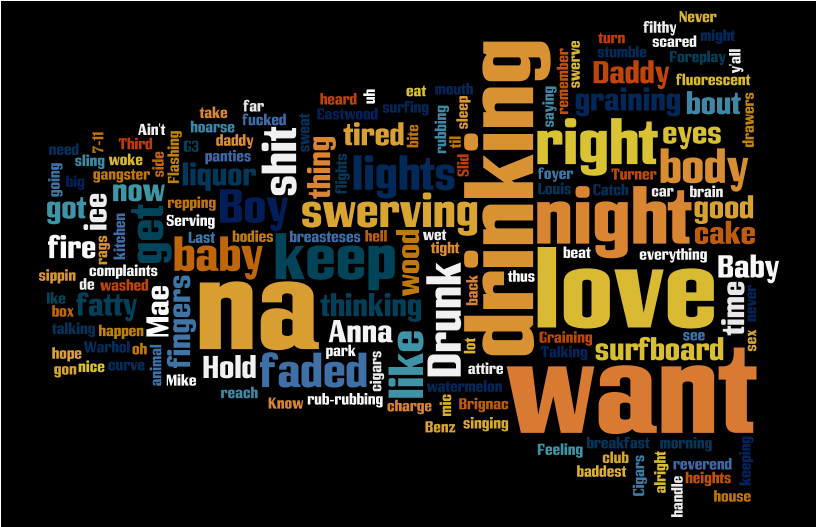
One of the early singles from the new album is Drunk In Love video, lyrics, and Wikipedia. Upon reading the title, I immediately thought of other “In Love” songs by Beyonce.

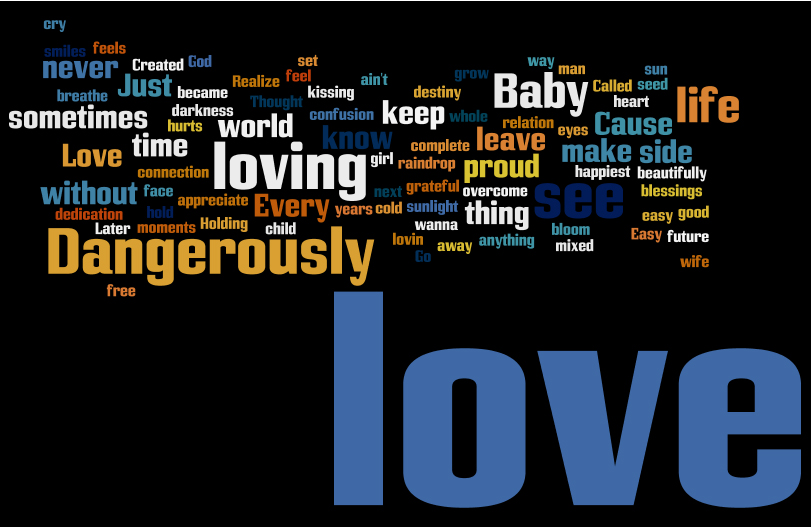
Dangerously In Love was a 2001 Destiny’s Child song that Beyonce is basically solo on. Video Lyrics

Dangerously In Love 2 was a 2002-2003 Beyonce song from her solo album Dangerously In Love Video Lyrics Wikipedia

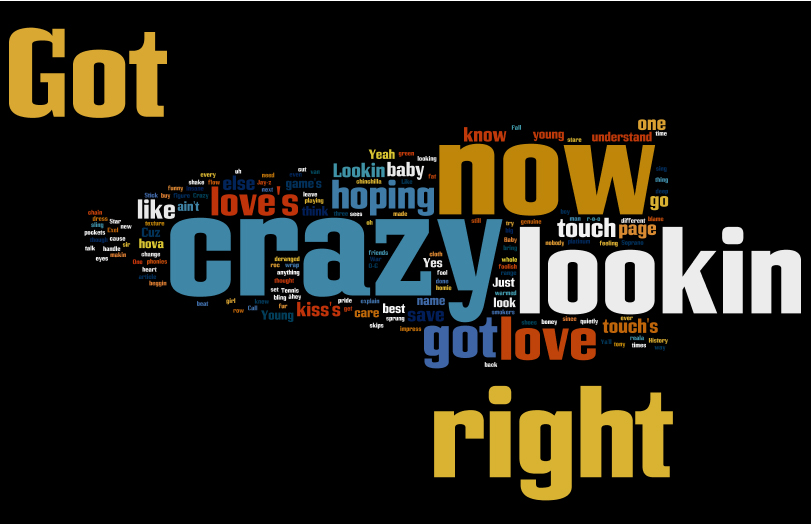
Also on that album was the perpetual favorite Crazy in Love featuring Jay-Z. Video Lyrics Wikipedia

The obvious change with Drunk In Love is that Beyonce is much more mature. She is a wife and a mother. She, as Pharrell noted in a video Beyonce put out about the album making process, can get away with talking about her sexuality more.

But hey, I like data, so why not look at a Wordle of these lyrics?

dangerouslyinlove1
This is Dangerously In Love

fangerouslyinlove2
This is Dangerously In Love 2 (essentially the same song)

crazyinlove
This is Crazy In Love

drunkinlove
And this is Drunk In Love

It seems like things have gotten more complicated for Bey and Jay, at least in what we see in the lyrics. Next step? Analysis of the video?

10 Jan

Facebook Friends analysis… So many options!

bestfriends

A Facebook plugin called Find Your Best Friend On FB has blown up this week.

I assume that it looks at private messaging frequency and frequncy of likes and comments and then pops out a photo of you with that person.

I don’t really like these apps because they’re scanning your private messages and that makes me nervous. I did install it, run it, and then remove it though. It did seem to be accurate.

But there are a ton of other fun ways to visualize and analyze your Facebook network.

The first one is from Wolfram Alpha which has a plug in that does a lot of analysis and visualization, although no “best friends.”

Instead it has social insiders (shares the most friends) and social connectors (bridges between groups (like my twin sister is a bridge between my family group and my schoolmates group).

You can also see what friends like your stuff the most and comments on your stuff the most. That was really interesting to me.

NameGenWeb is my favorite app for this but it is down right now.

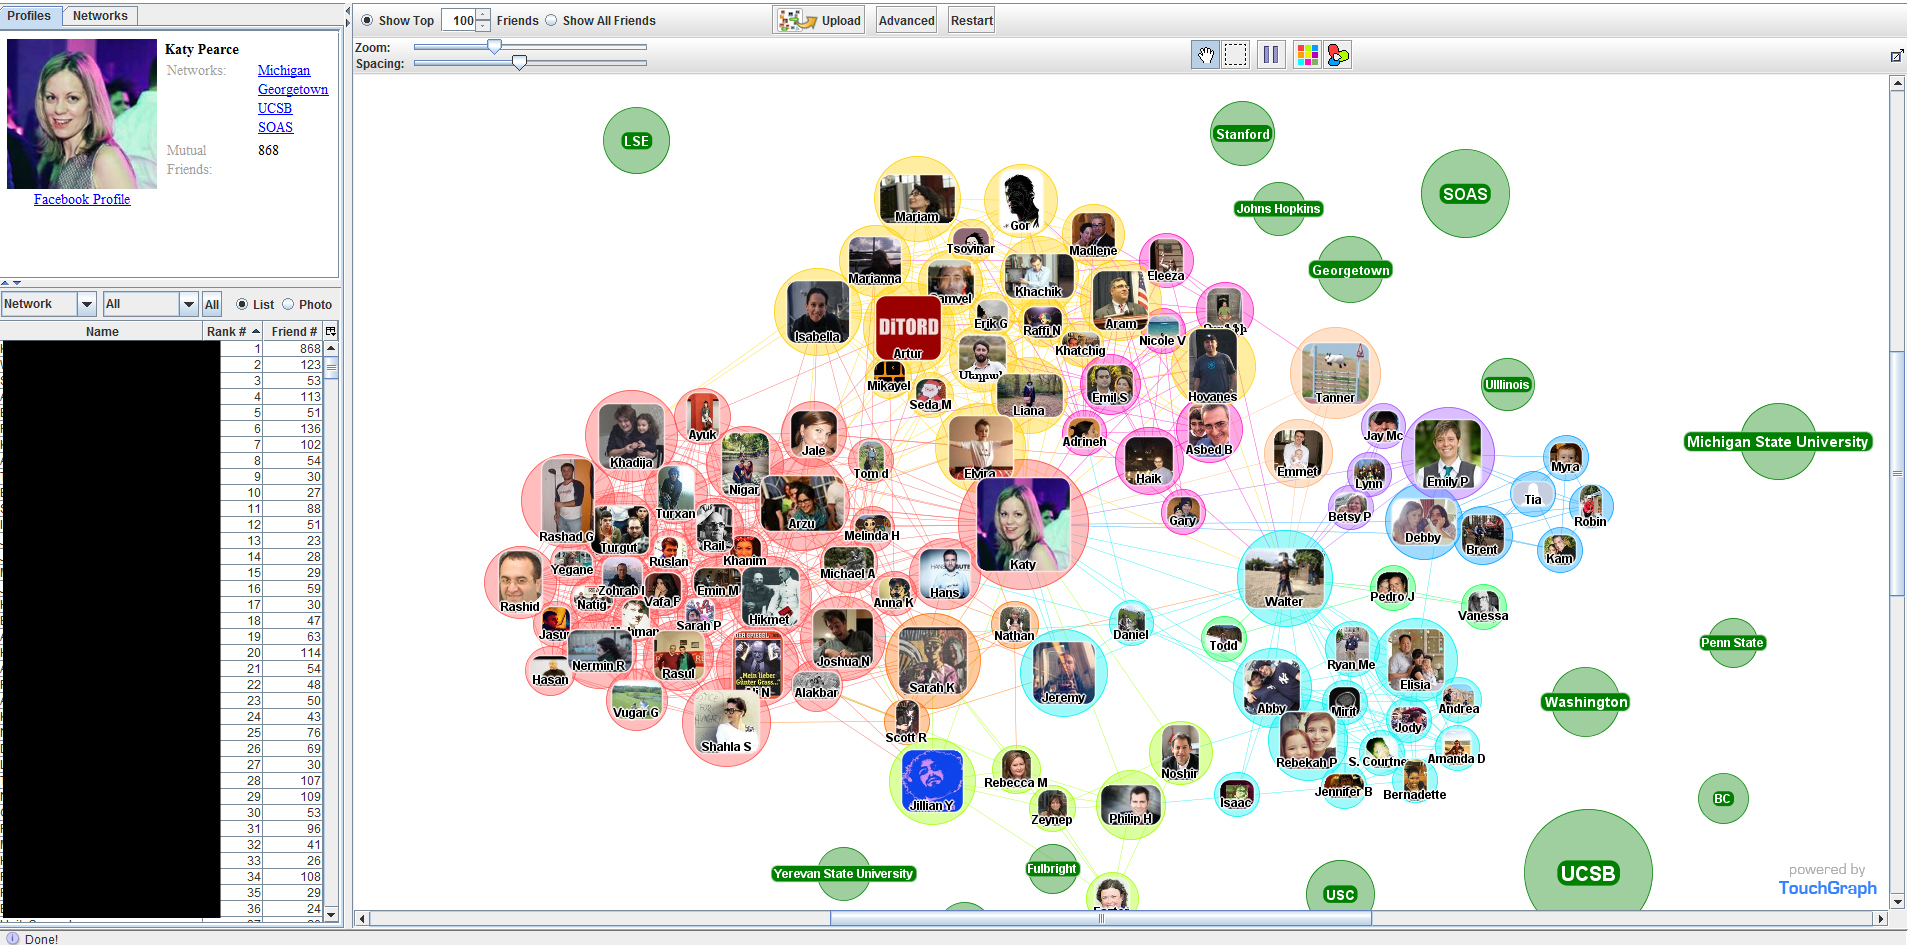
TouchGraph is pretty good too and is fast and mostly focuses on the networks that people have put themselves in (usually university networks). It ranks your friends (on number of friends in common). This wasn’t very accurate for me because it looks at those university networks more strongly than other factors. So, for example, a lot of people I grew up with attended Michigan State University in the late 1990s. I also have a number of friends who I did not grow up with who went there for their PhDs in the mid-late 2000s. That doesn’t mean much in terms of the connections between these groups.
touchgraph

FriendsGraph is an interesting one but the visualizations are pretty boring.

friendsgraph

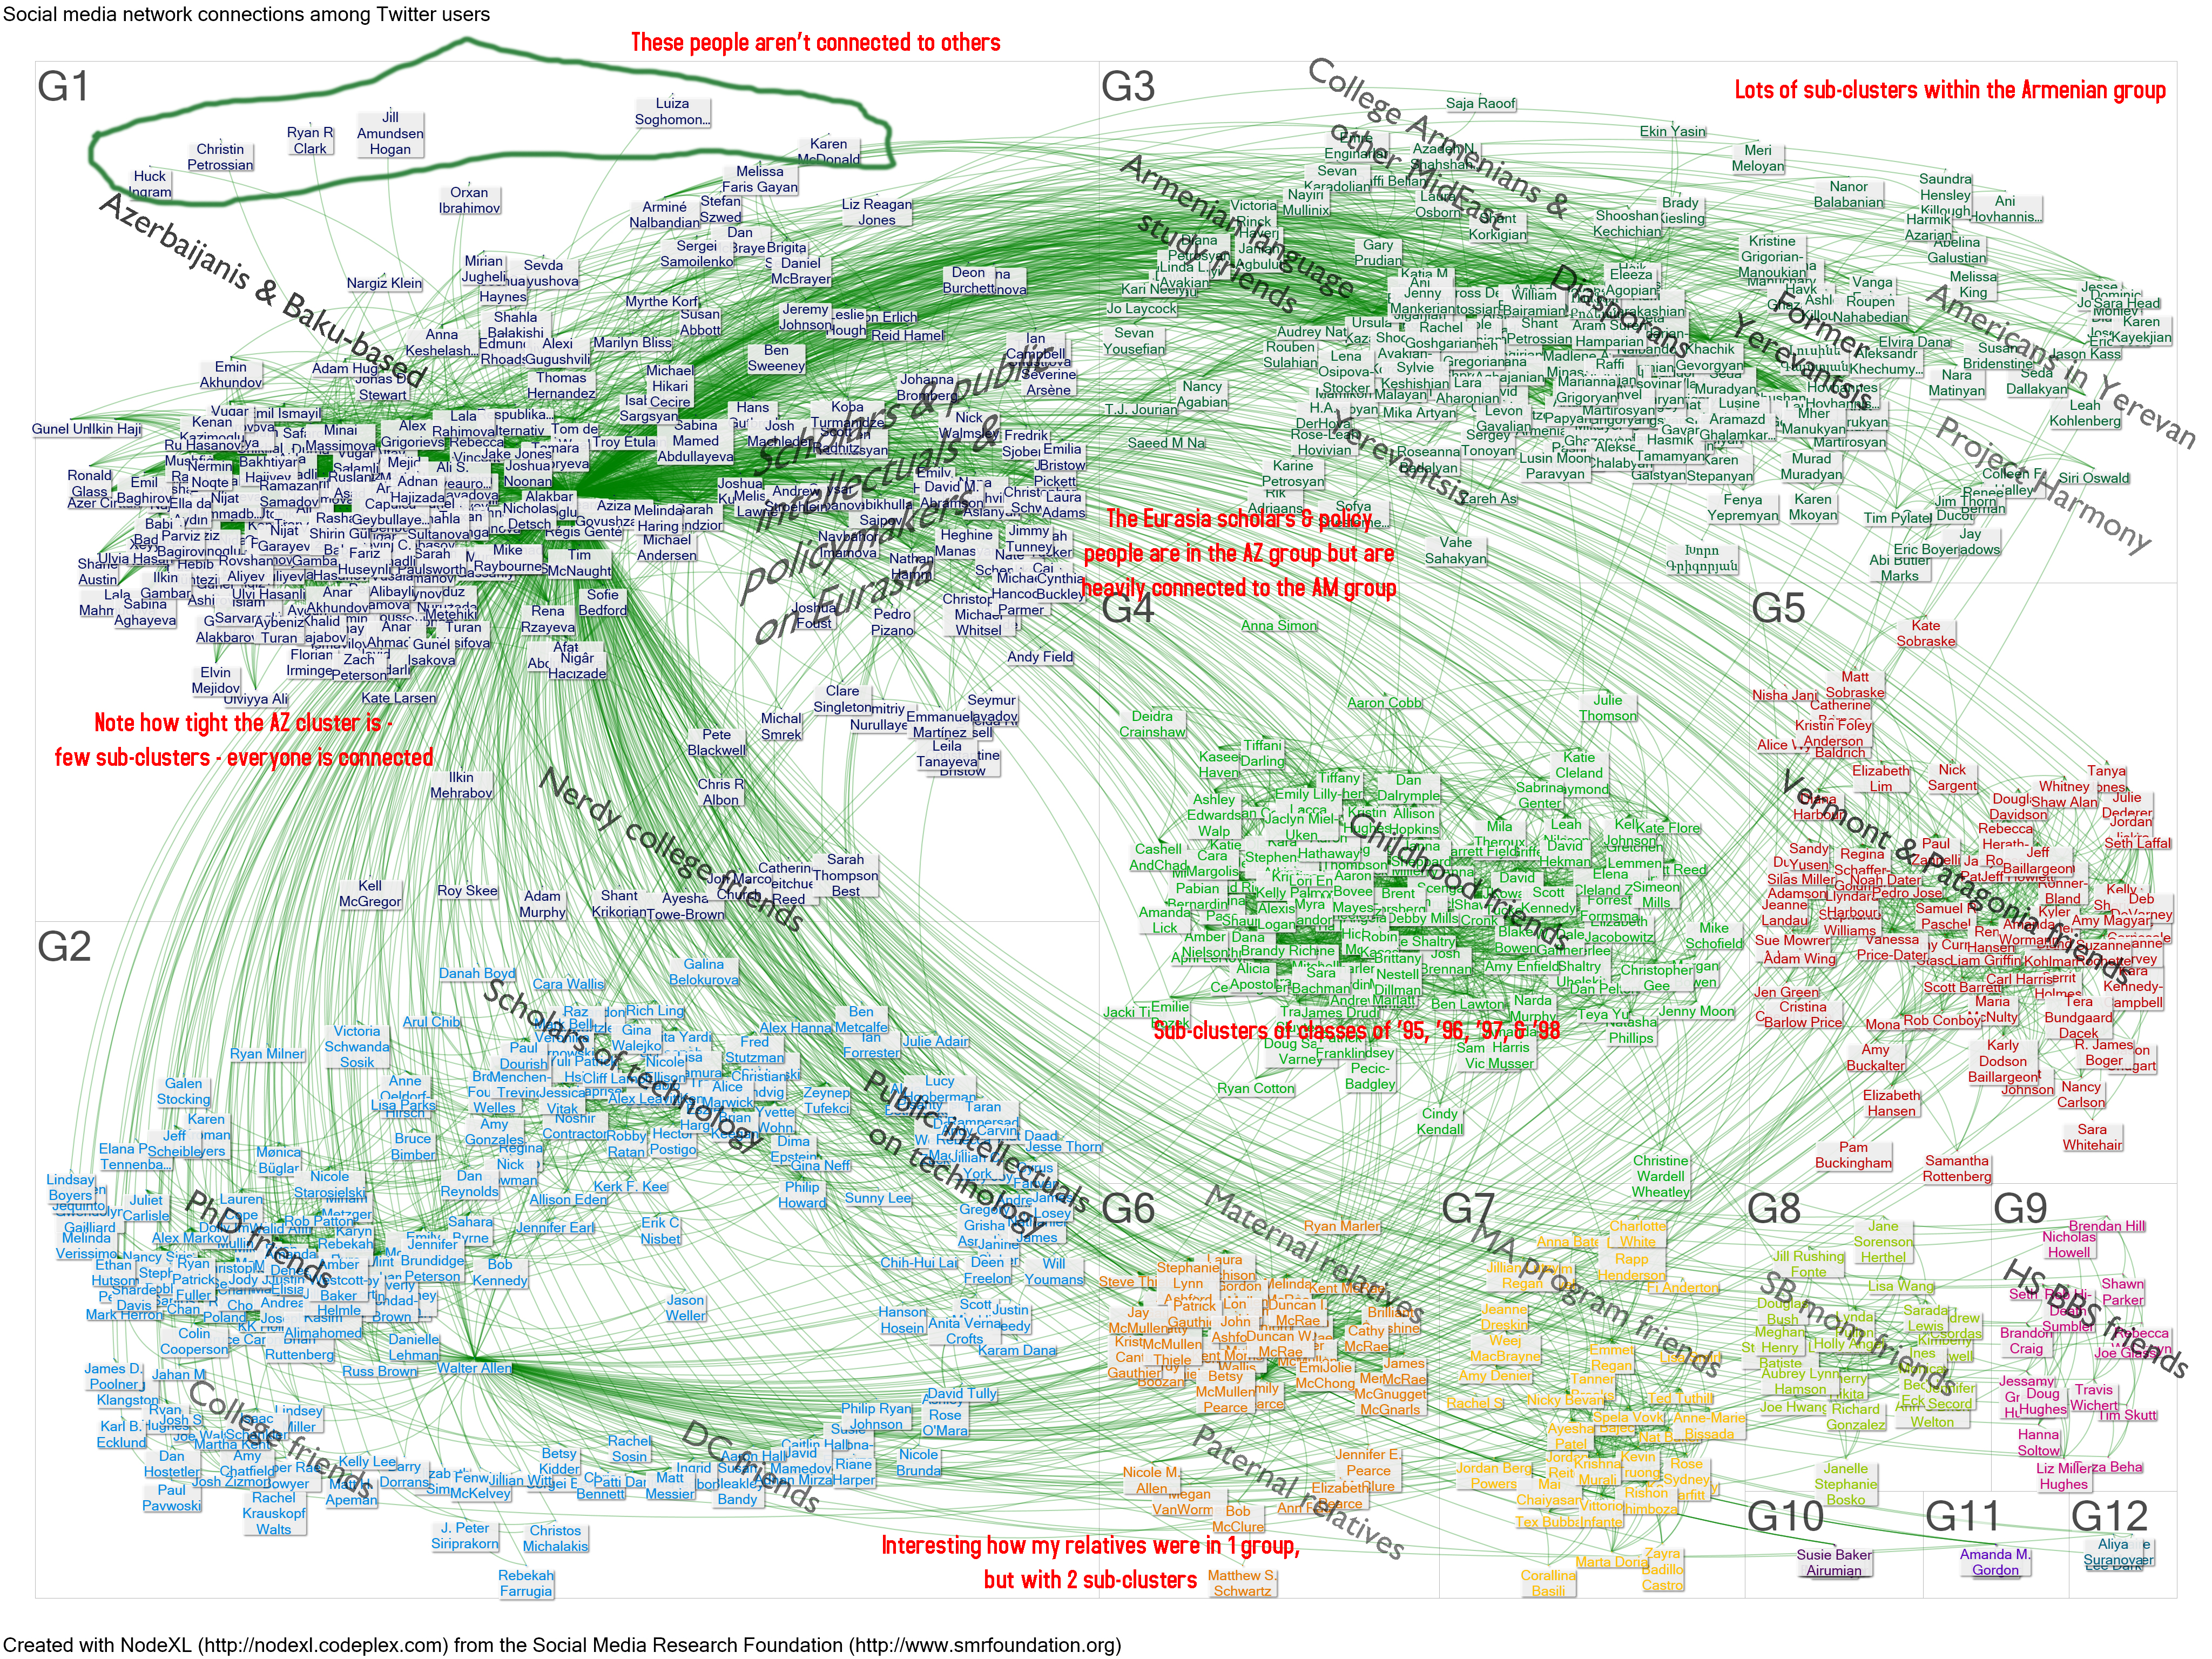
I like to use NodeXL and its Social Media Importer, but using it requires you to download some programs, so this is not a quick click. But the analysis is much more detailed (I added the labels to this picture).

11612479046_3eb5d0a825_o


08 Jan

Monthly income “for a normal life”

Since it seems like people enjoyed my last post about poverty, I thought I’d do a quick additional analysis. (By the way, ALL posts related to poverty are tagged for your easy browsing). And why do I, a scholar of technology do all this analysis of poverty? Because my research is actually about technology and inequality. And poverty is a very important topic to me. I wrote a paper a few years ago about the challenges of measuring poverty in the South Caucasus (I spent many months of my PhD dissertation tearing this issue apart. I’m still not satisfied with the ways of measuring this, but alas, other projects call to me.)

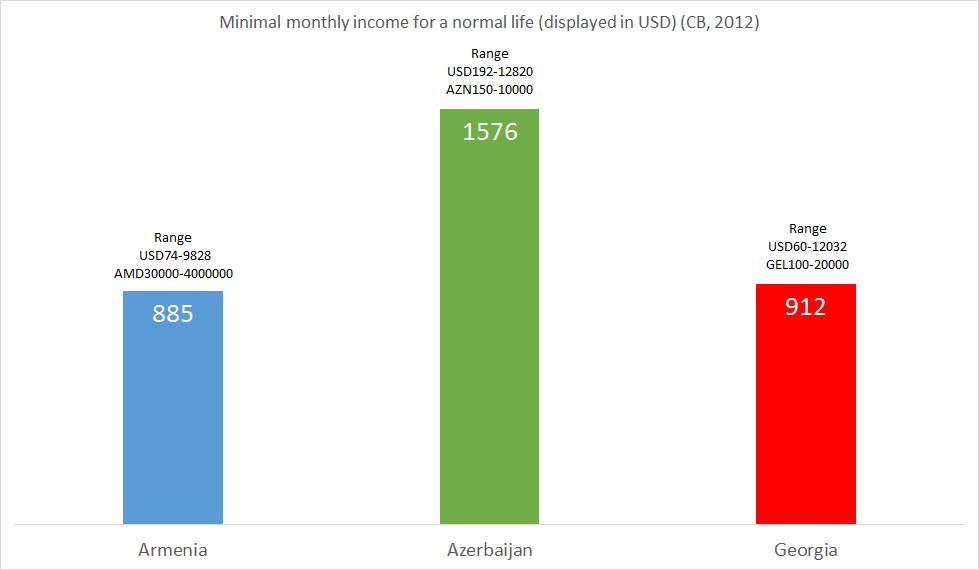
But here’s some interesting analysis – in the 2012 Armenians, Azerbaijanis, and Georgians were asked how much income would be required every month at minimum to live a normal life. They answered in their own currency, but this is converted to a consistent American dollar.

NORMALLIFE

Armenians and Georgians answered about the same (note the ranges in local currency though – I can imagine people answering a random round number), but Azerbaijanis felt that a household would need about USD1600 a month to live a normal life. Obviously I am a foreigner, but I can certainly attest that living in Baku, and consumer goods in Azerbaijan more generally, are much more expensive than in Armenia or Georgia. And apparently my own observations are not far off.

NORMALLIFEREGION

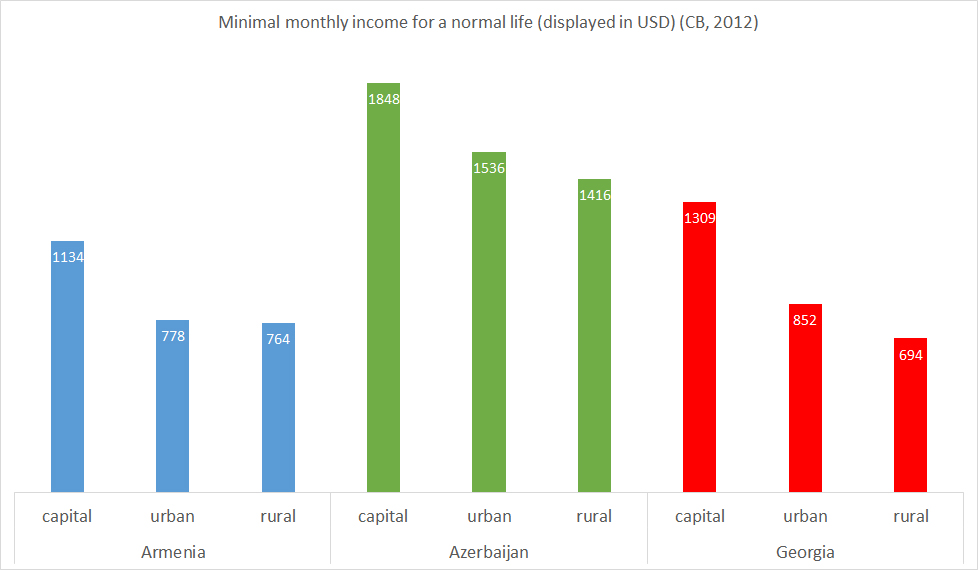
When broken down by region, Armenia and Georgia end up being pretty close again, with Tbilisi being slightly more expensive than Yerevan, in terms of what people think that need for a normal life.

AMDISTUSD

AMDIST

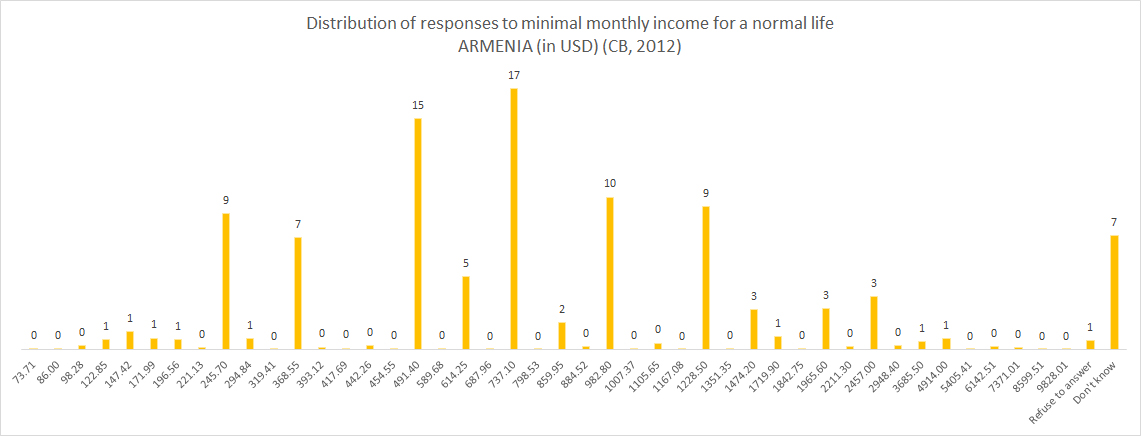
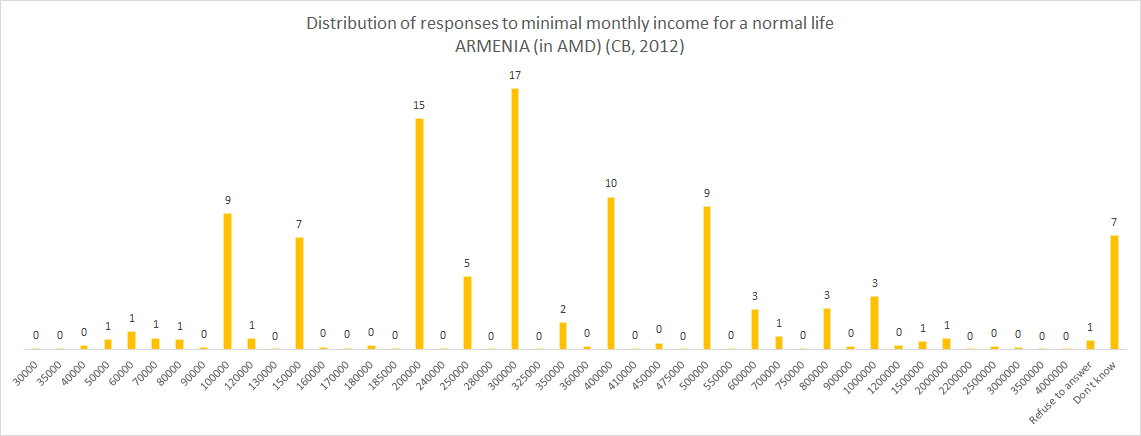
Looking at the distribution of Armenian answers, most people said 200000 or 300000 AMD (490 or 737 in USD).

AZDISTUSD

AZDIST

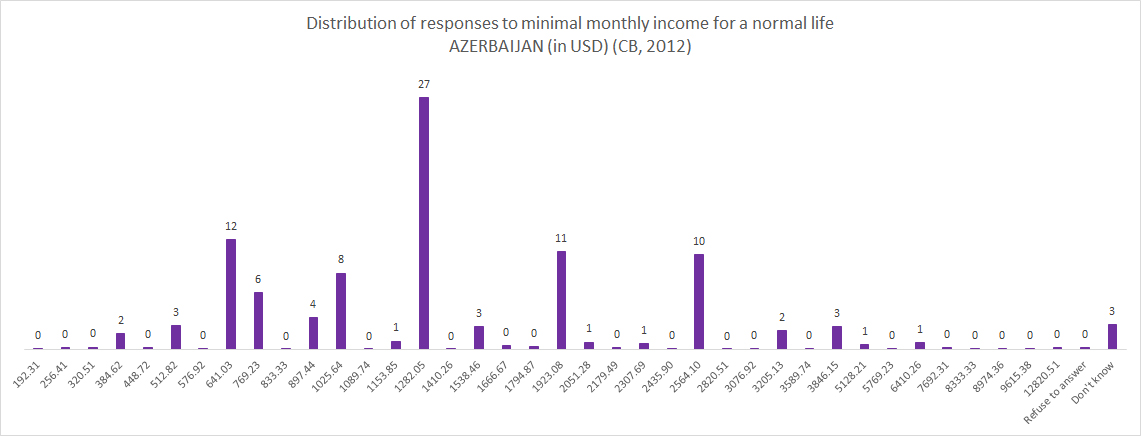
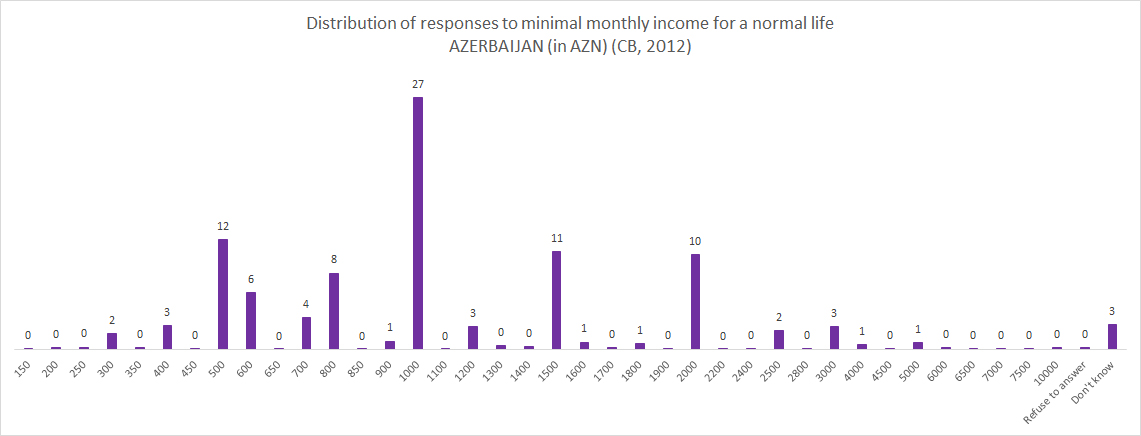
Most Azerbaijanis said 1000 AZN (1282 in USD).

GEORGIADISTUSD

GEORGIADIS

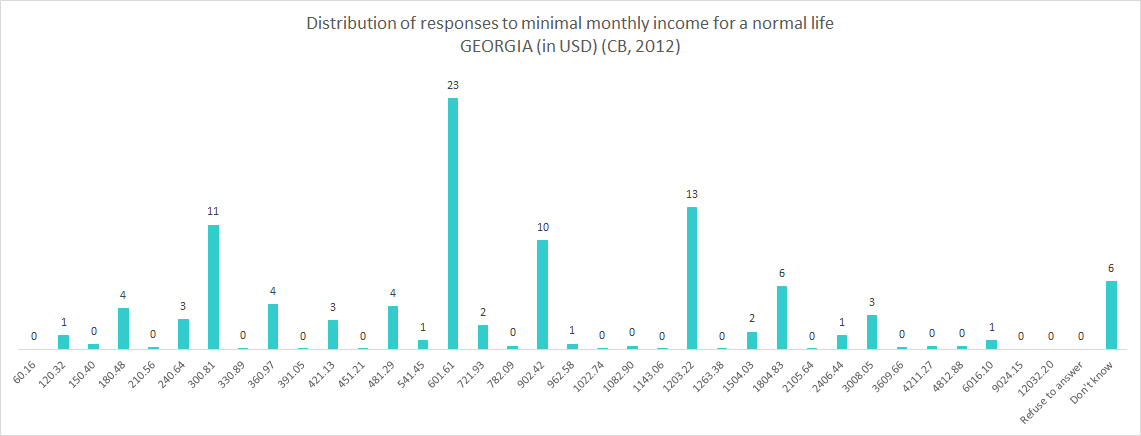
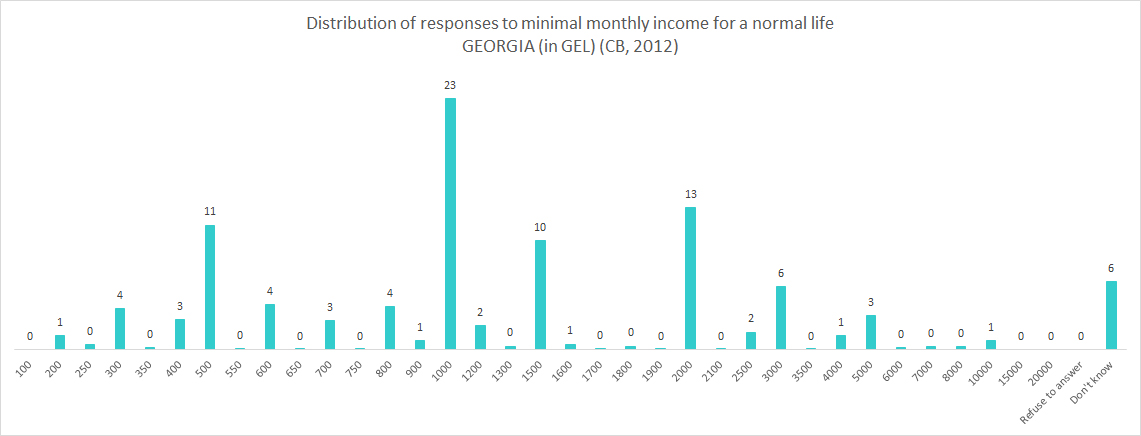
For Georgians, most said 1000 GEL (602 USD).

This confirms that a lot of people are just picking a round number. But still, it is interesting to look at.

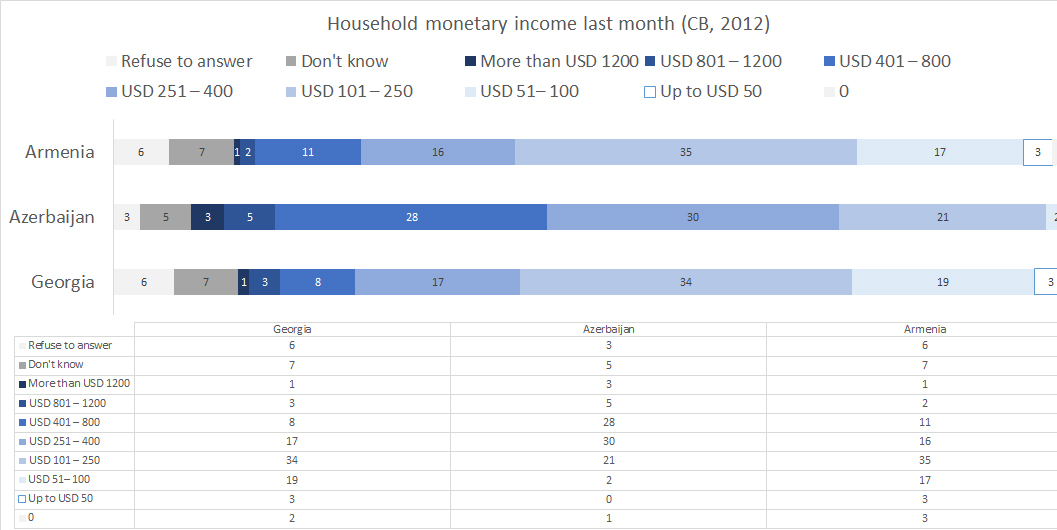
INCOMEDIST

Ironically, when looking at the actual household monthly monetary income, very few South Caucasians are actually making as much as they say they need for a normal life. So does this mean that people strongly feel that they need more? I would assume. Or perhaps there are additional sources of income – remittances, borrowing, credit, etc. that are not factored in here. If less than 3% of Armenians are making as much as they said they need for a normal life, what kind of lives are people leading?