Let’s have a data party
Last year I wrote a blog post about triangulating different data sources. I used the example of mobile phone ownership and the ITU, Caucasus Barometer, and Gallup. In that post I said:
“The point I’d like to make is that these statistics are complicated and it is hard to get at the “right” number. That’s why we try to triangulate — look at different sources of data to see if things seem right. We also should always assess the credibility of the source of the data.
Data sources:
ITU is the UN’s official statistics and these numbers come from the governments themselves who usually get the numbers from the telecommunications companies. These companies count number of SIM cards sold and it is not unusual for people to have multiple SIM cards. This is data to be highly skeptical about. For the question about mobile penetration, this isn’t actually percent, it is number of mobile phones per 100 people.
Caucasus Barometer, Gallup, and EBRD are surveys taken face-to-face in households. All use different sampling techniques and are collected by different organizations. None are perfect, but they’re as good as we’ve got. Of the three, I trust Gallup the least.
Noteworthy:
All of these were collected at different times of the year.
Margin of error varies in all of these.
A ~4-6 point difference is within the margin of error and shouldn’t be looked at with too much suspicion.”
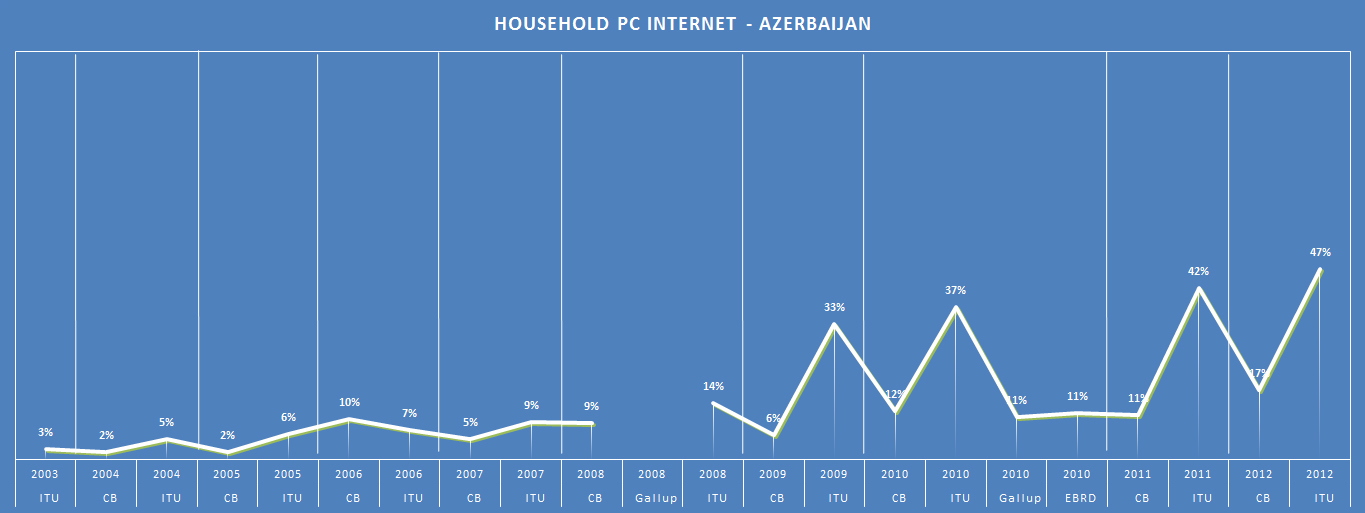
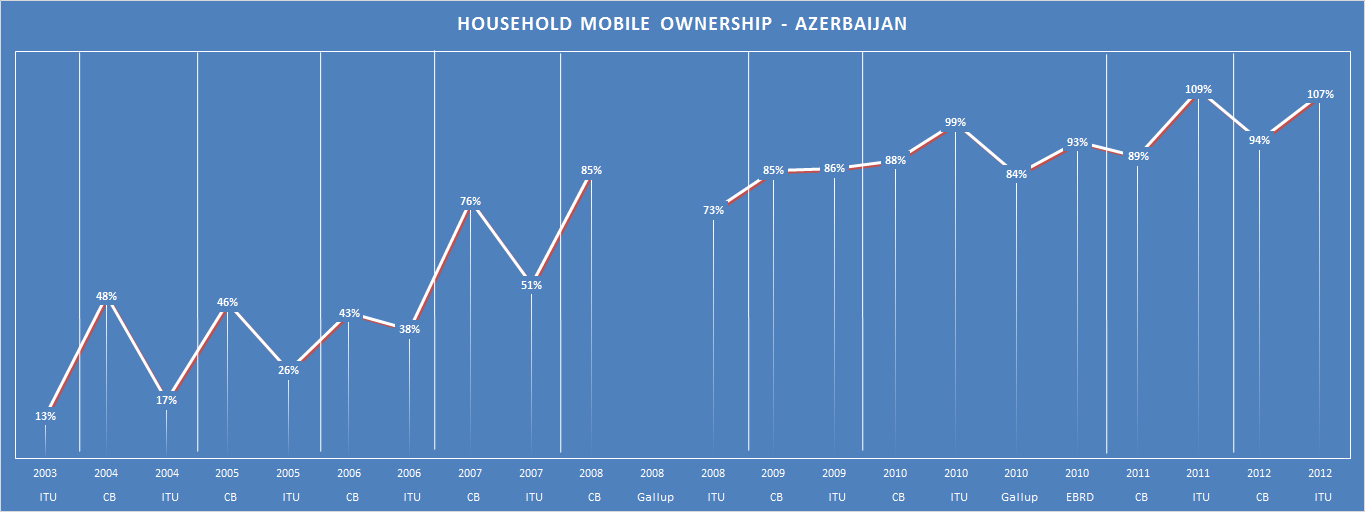
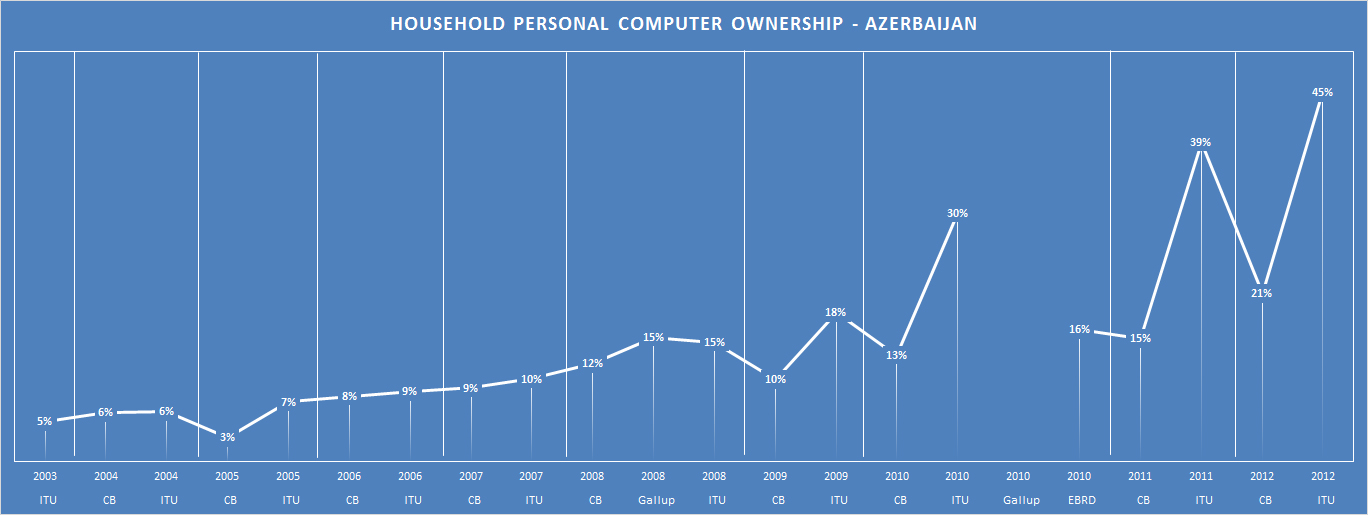
With those same rules applying, here are some results from different sources from Azerbaijan.
For what it is worth, I LOVE having more data. The more data we have measuring similar things, the more sure we can be of the results. 2010 is a great year here because of the 4 data sources (for some questions). But please, reach your own conclusions about what the “correct” percentage is.
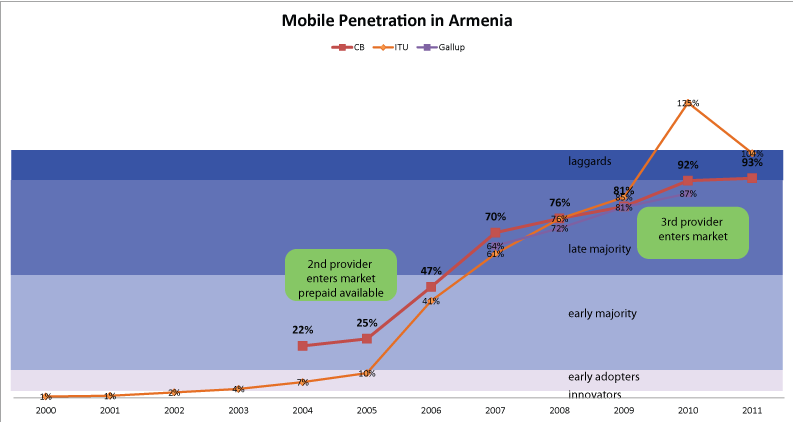
PPS, here is a similar comparison of Armenia’s statistics from a few years ago. And here’s one for Armenia specifically on mobile comparison.


