15 Mar

Voting in 2013 – Armenia, Azerbaijan, Georgia

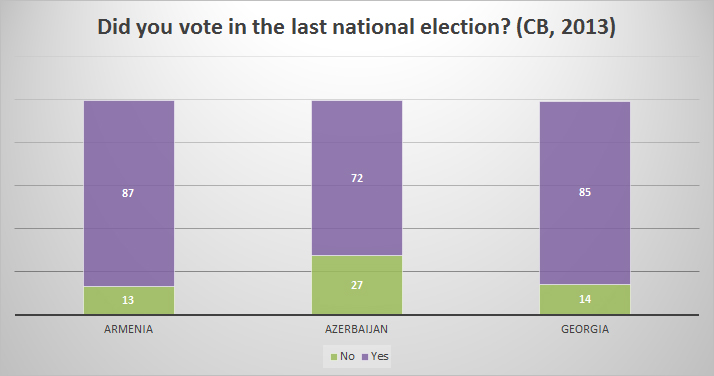
The new Caucasus Barometer is out and I did some analysis on voting behaviors. (Here’s 2011 and Here’s 2012.)

vote

These voting rates seem to match up with the official reported rates.

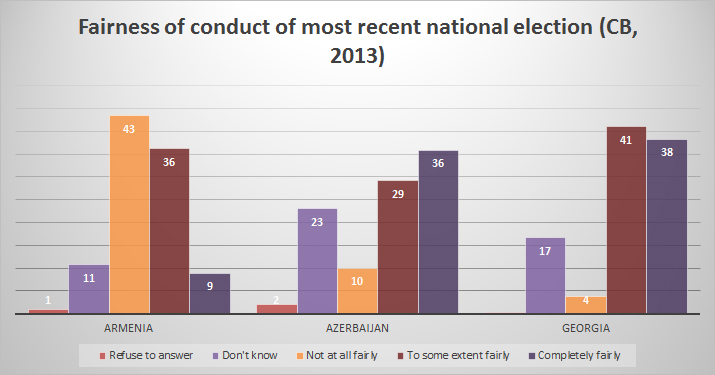
fairness

Wow – this is all over the place. Georgia isn’t a surprise, Armenia is interesting, and Azerbaijan is depressing.

pARTICIPATE

Interesting with regard to the reported turn outs.

04 Mar

2013 Internet Penetration – Armenia, Azerbaijan, Georgia

My favorite day of the year is here! No, not Fat Tuesday – but new Caucasus Barometer data day!

I’ll be posting a variety of analyses over the coming weeks, but here’s the one everyone loves – percent of adult Internet users in each country.

First, let us all acknowledge that I hate talking about Internet penetration because I think that it is meaningless to talk about percentage of users without contextualizing the economic, social, political, and cultural environment in which Internet use exists.

And here are dozens of other posts about technology use in the Caucasus.

This is data from the Caucasus Barometer, which is a trustworthy source. Read more about it at the link or check out their page and play around with the data. These results are all for adults.

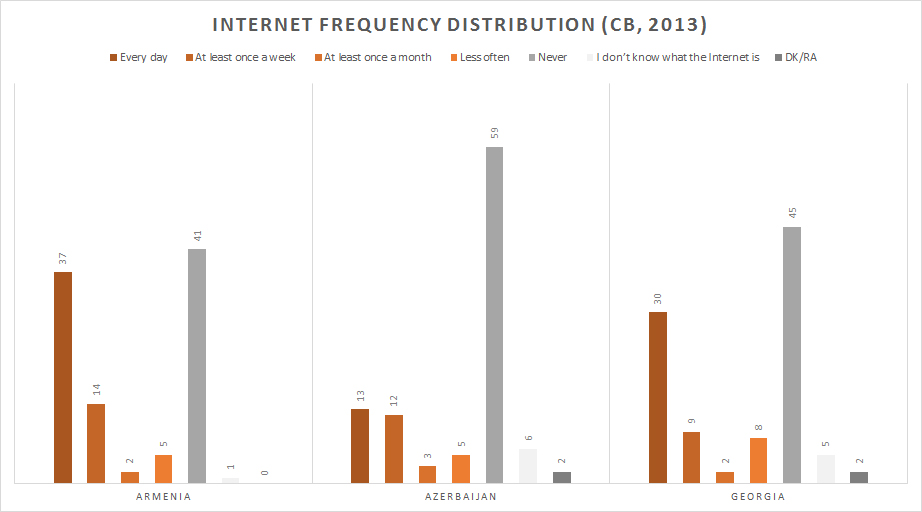
First, this year’s distribution:

freq3

You can see that a large percentage of Caucasians aren’t using the Internet. Again, I’d rather be talking about who those people are (poorer, older, rural, less educated, women) than just percentages, but alas, this is what you all want, isn’t it? 😉 You can also see that most Internet users are online daily, although in Azerbaijan, they’re fairly divided between daily and once a week.

Now, on to the trends over time:

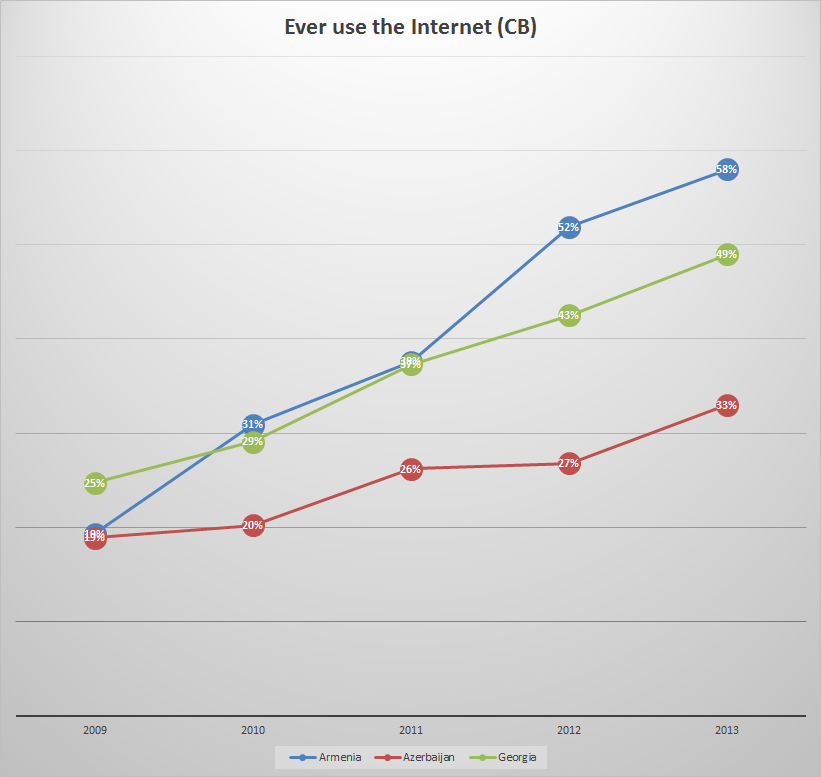
Next, those who ever use:

ever

Ever used – this is a bit meaningless, as the benefits of Internet use are certainly relative to how often one is using it. Getting online less than one a month is an entirely different experience than being online daily (or all day long as is often the case.) But again, people are really interested in this. Each country saw some growth, but certainly the growth will  slow down as time passes.

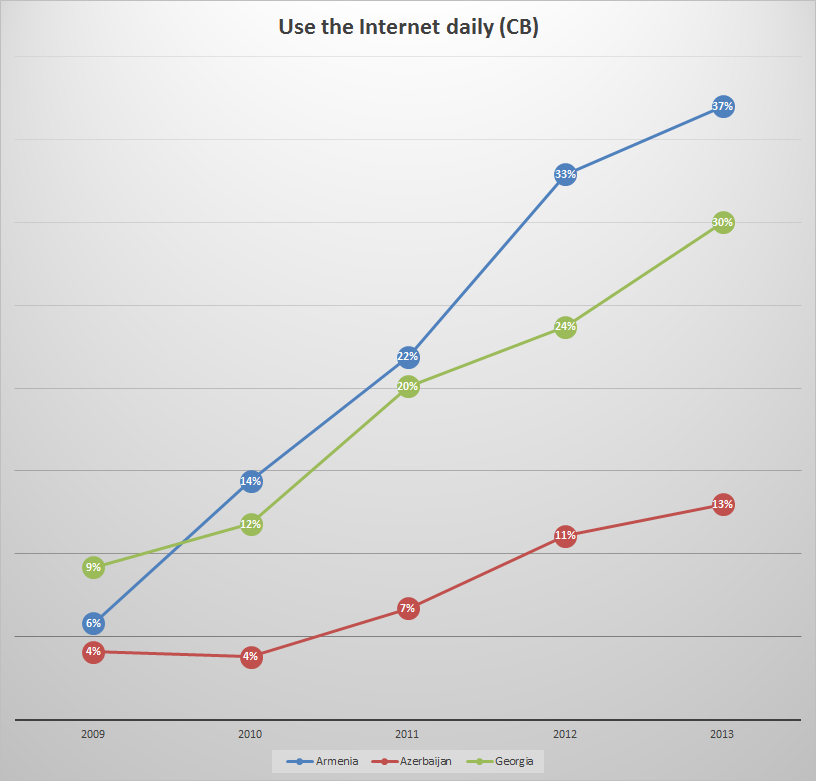
Daily use trends:

daily

In my eyes, daily use is the most meaningful measure here. Those who are online daily are getting the most out of their Internet use. Once again, you can see that there is a huge gap between Armenia and Georgia with Azerbaijan. I’ve discussed this at length, but one reason for this is the lower percentage of Azerbaijani women online. But there are other reasons too. In the coming weeks I’ll elaborate on this.

For those that wonder if these Azerbaijan numbers are legitimate, I point you to this blog post.

Coming soon with be posts on:

gender differences
social networking site use
ownership of technology

I’m happy to answer questions!

01 Mar

March 2014 – Facebook ad suggestions at Facebook use in Armenia, Azerbaijan, and Georgia

This is an update to this post from January.

It is hard to know how many people in a country are using Facebook, but through Facebook’s Ad selling program, you can get some rounded information. The numbers they give are not exact, so these percentages displayed below are not accurate for the true number of users. THESE RESULTS MAY NOT ADD UP TO REASONABLE 100%S. I calculated everything from the actual population. So when it says 36% of Georgian women are X, I calculated from the population data from the World Bank. This isn’t SOLID information, but it does come FROM Facebook, so it is a little bit better than SocialBakers.

This is what it looks like to find out this information:

facebook

So, Armenia has 2,974,184 people, Azerbaijan 9,590,159 people, and Georgia 4,555,911 people total according to the World Bank and after I subtracted those age 0-14 (World Bank’s category, not mine) the populations are Armenia: 2,460,436; Azerbaijan: 7,419,487; Georgia: 3,855,233.

Facebook Ads says that this many people in each of those countries is a potential viewer of their ads (thus a Facebook user): Armenia: 580,000 (in January) 620,000 (in March); Azerbaijan: 1,320,000 (in January) 1,380,000 (in March); Georgia: 1,220,000 (in January) 1,280,000 (in March).

Thus, here are the percentages of the age 14+ populations of each country who are on Facebook:

a(January)a2

Armenia: 25%
Azerbaijan: 19%
Georgia: 34%

So that is interesting, but let us look at gender differences (I took the direct gender population data from the age distribution tables – this is not 50/50, but more accurate).

b(January)b2

Armenians and Georgians are evenly distributed gender-wise on Facebook. And Azerbaijanis, well, this gender difference isn’t surprising.

c(January)c2

In terms of the balance of users, Armenians are fairly even, Georgians have a bit more women and you can see that about 2/3rds of Azerbaijanis on Facebook are men. Although this may seem shocking, this is much better than it has been in previous years.

A category that the World Bank uses is ages 15-24 and we know that 18% of Armenians and Azerbaijanis and 14% of Georgians are in that age range – I again used the raw numbers from the World Bank to calculate these.

Armenia Azerbaijan Georgia
ages 15-24 280000 780000 540000
male 15-24
500000 260000
% to pop 0.54032849 0.574409822 0.856504848
female 15-24 134000 280000 280000
% to pop 0.548320768 0.329550564 0.9054309690.905430969

d(January) EDIT: THIS SHOULD BE 15-24 YEAR OLDS!

d2

Wow Georgia! Most Georgian young adults are on Facebook, no doubt about that. About half of Armenian young adults and for Azerbaijan 57% of male young adults and a third of female young adults.

I also looked at the 13-18 year old users on Facebook, but I can’t compare them to the total population of 13-18 year old males and females in these states because I don’t have the data from the WorldBank. But here are the raw numbers and the ratio of male to female.

Armenia Azerbaijan Georgia
ages 13-18 130000 300000 240000
male 13-18 66000 190000 116000
female 13-18 64000 110000 128000
male/female 1.03125 1.727272727 0.90625

And here are the raw numbers for 18+, which I can’t analyze by age category because I don’t have the WorldBank data to compare, and the ratio of male to female.

Armenia Azerbaijan Georgia
ages 18+ 520000 1180000 110000
male 18+ 260000 760000 500000
female 18+ 260000 420000 600000
male/female 1 1.80952381 0.833333333

Those ratios in Azerbaijan are notable.

For comparison, here’s Caucasus Barometer derived information from 2012.

13 Jan

Facebook in Armenia, Azerbaijan, and Georgia – 2013 – with a gender focus

While figuring out technology penetration rates isn’t my main interest, people do ask me a lot.

I get nervous about giving percentages because I am more interested in demographic divides – gender, wealth, education, region, etc. And for the most part, giving penetrations rates doesn’t allow for that. (See here for more on this.)

But a journalist was asking today about Facebook users in Azerbaijan and I learned about a new way to find out how many Facebook users are in a country — through Facebook’s Ad selling programs. While I don’t totally trust this information (numbers are too round, this counts ever used, not current or regular users), it is interesting. ETA: But the numbers they give  are not exact, so these percentages displayed below are not accurate for the true number of users. I calculated everything from the actual population. So when it says 36% of Georgian women are X, I calculated from the population data from the World Bank. This isn’t SOLID information, but it does come FROM Facebook, so it is a little bit better than SocialBakers.

This is what it looks like to find out this information:

facebook

So, Armenia has 2,974,184 people, Azerbaijan 9,590,159 people, and Georgia 4,555,911 people total according to the World Bank and after I subtracted those age 0-14 (World Bank’s category, not mine) the populations are Armenia: 2,460,436; Azerbaijan: 7,419,487; Georgia: 3,855,233.

Facebook Ads says that this many people in each of those countries is a potential viewer of their ads (thus a Facebook user): Armenia: 580,000; Azerbaijan: 1,320,000; Georgia: 1,220,000 (for those that think this is a competition, Georgia is “winning”). Let us acknowledge that these numbers from Facebook are way too round, thus they are rough estimates. We can’t trust them completely. But let’s see what we have.

Thus, here are the percentages of the age 14+ populations of each country who are on Facebook:

a

Armenia: 24%
Azerbaijan: 18%
Georgia: 32%

So that is interesting, but let us look at gender differences (I took the direct gender population data from the age distribution tables – this is not 50/50, but more accurate).

b

Armenians and Georgians are evenly distributed gender-wise on Facebook. And Azerbaijanis, well, this gender difference isn’t surprising.

c

In terms of the balance of users, Armenians are fairly even, Georgians have about 10% more women and you can see that about 2/3rds of Azerbaijanis on Facebook are men. Although this may seem shocking, this is much better than it has been in previous years.

A category that the World Bank uses is ages 15-24 and we know that 18% of Armenians and Azerbaijanis and 14% of Georgians are in that age range – I again used the raw numbers from the World Bank to calculate these.

Armenia Azerbaijan Georgia
ages 15-24 280000 780000 540000
male 15-24 136000 500000 260000
% to pop 0.50332 0.552317 0.795326
female 15-24 134000 280000 280000
% to pop 0.524821 0.329551 0.905431

d

EDIT: THIS SHOULD BE 15-24 YEAR OLDS!

Wow Georgia! Most Georgian young adults are on Facebook, no doubt about that. About half of Armenian young adults and for Azerbaijan 55% of male young adults and a third of female young adults.

I also looked at the 13-18 year old users on Facebook, but I can’t compare them to the total population of 13-18 year old males and females in these states because I don’t have the data from the WorldBank. But here are the raw numbers and the ratio of male to female.

Armenia Azerbaijan Georgia
ages 13-18 124000 300000 240000
male 13-18 62000 190000 114000
female 13-18 62000 112000 124000
male/female 1 1.696429 0.919355

And here are the raw numbers for 18+, which I can’t analyze by age category because I don’t have the WorldBank data to compare, and the ratio of male to female.

Armenia Azerbaijan Georgia
ages 18+ 480000 1140000 106000
male 18+ 240000 740000 480000
female 18+ 240000 420000 560000
male/female 1 1.761905 0.857143

Those ratios in Azerbaijan are notable.

For comparison, here’s Caucasus Barometer derived information from 2012.
08 Jan

Monthly income “for a normal life”

Since it seems like people enjoyed my last post about poverty, I thought I’d do a quick additional analysis. (By the way, ALL posts related to poverty are tagged for your easy browsing). And why do I, a scholar of technology do all this analysis of poverty? Because my research is actually about technology and inequality. And poverty is a very important topic to me. I wrote a paper a few years ago about the challenges of measuring poverty in the South Caucasus (I spent many months of my PhD dissertation tearing this issue apart. I’m still not satisfied with the ways of measuring this, but alas, other projects call to me.)
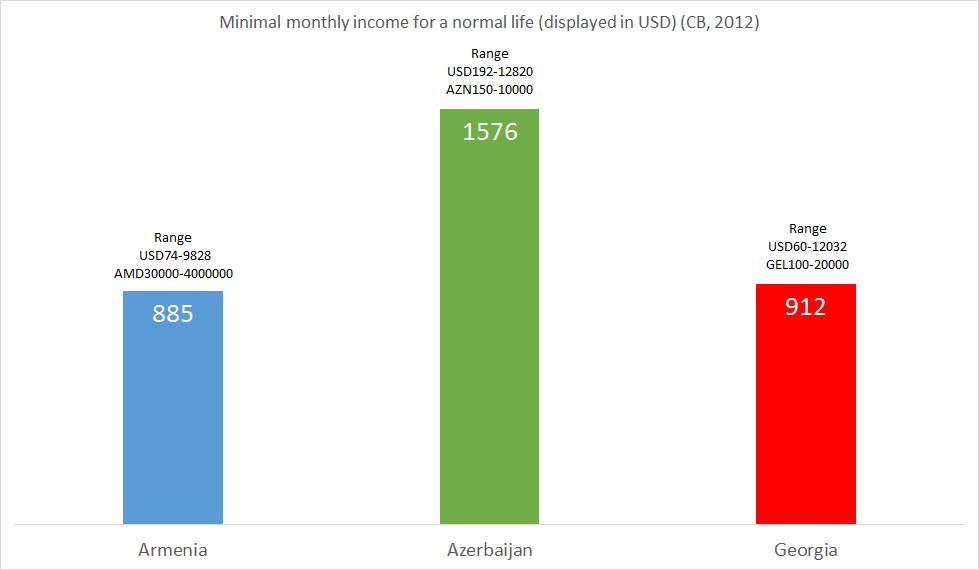
But here’s some interesting analysis – in the 2012 Armenians, Azerbaijanis, and Georgians were asked how much income would be required every month at minimum to live a normal life. They answered in their own currency, but this is converted to a consistent American dollar.

NORMALLIFE

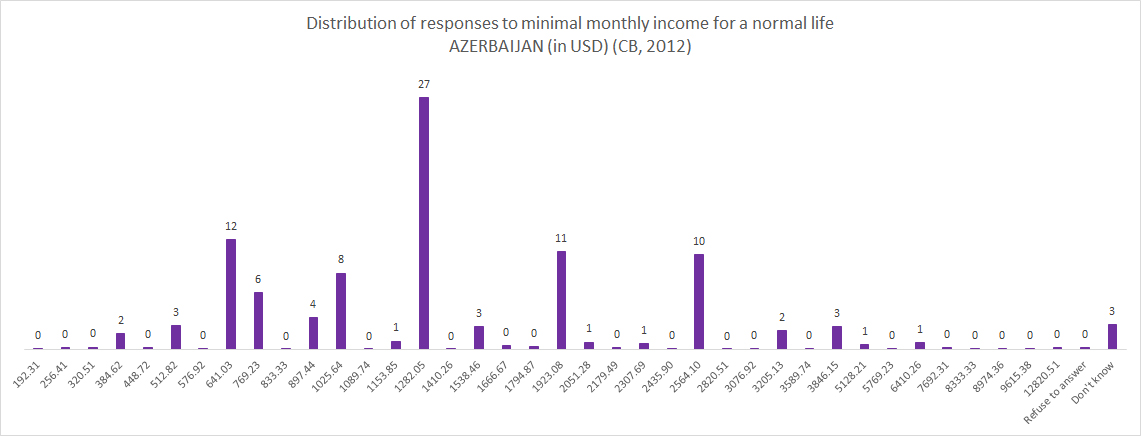
Armenians and Georgians answered about the same (note the ranges in local currency though – I can imagine people answering a random round number), but Azerbaijanis felt that a household would need about USD1600 a month to live a normal life. Obviously I am a foreigner, but I can certainly attest that living in Baku, and consumer goods in Azerbaijan more generally, are much more expensive than in Armenia or Georgia. And apparently my own observations are not far off.

NORMALLIFEREGION

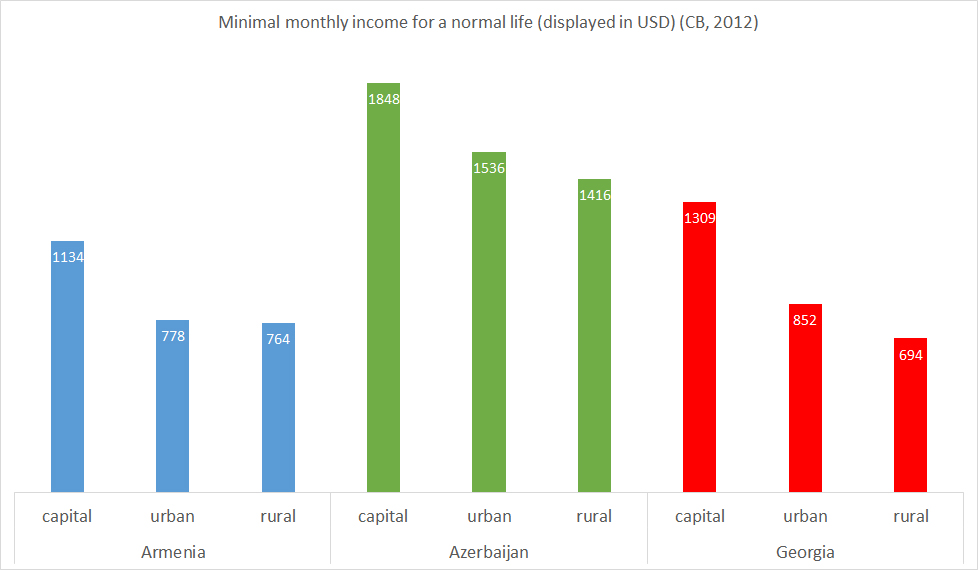
When broken down by region, Armenia and Georgia end up being pretty close again, with Tbilisi being slightly more expensive than Yerevan, in terms of what people think that need for a normal life.

AMDISTUSD

AMDIST

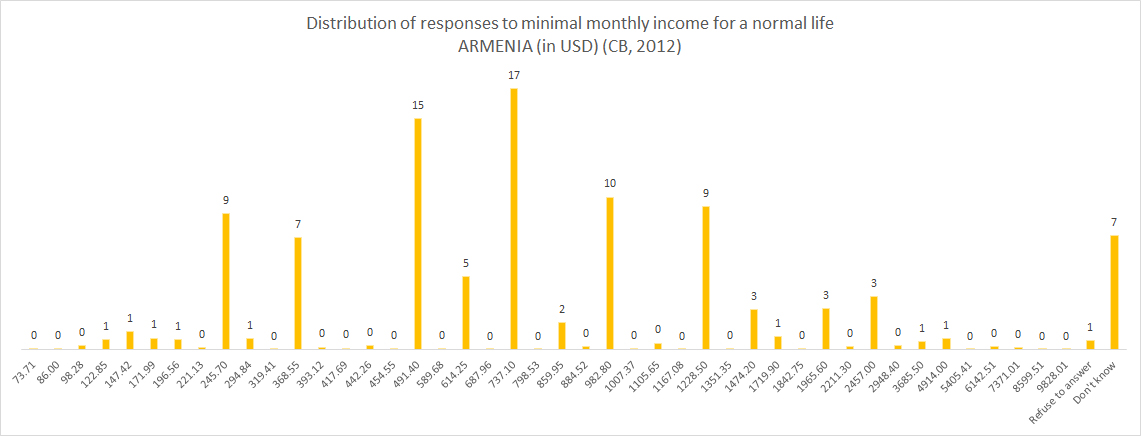
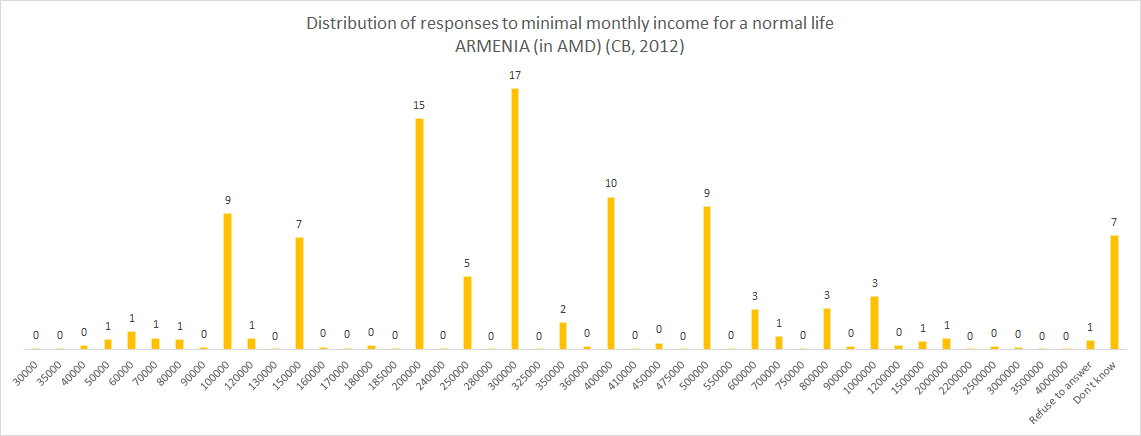
Looking at the distribution of Armenian answers, most people said 200000 or 300000 AMD (490 or 737 in USD).

AZDISTUSD

AZDIST

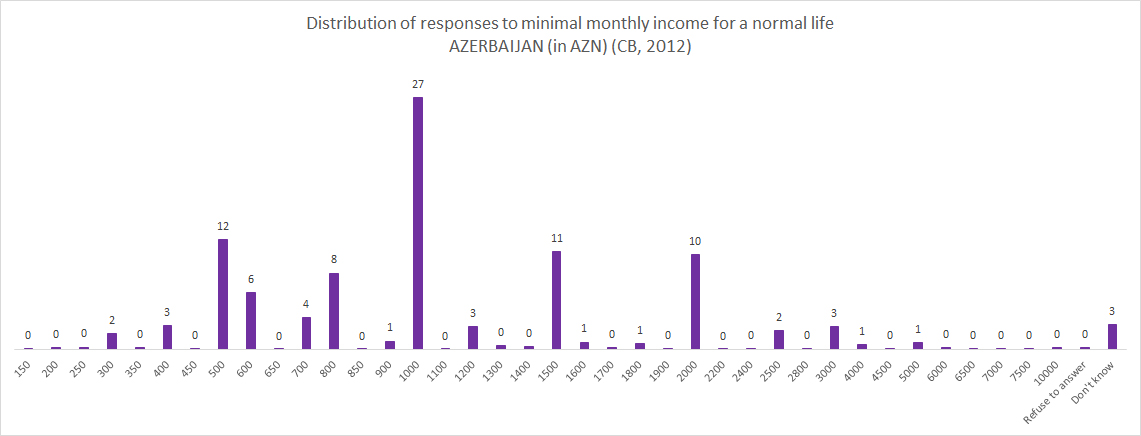
Most Azerbaijanis said 1000 AZN (1282 in USD).

GEORGIADISTUSD

GEORGIADIS

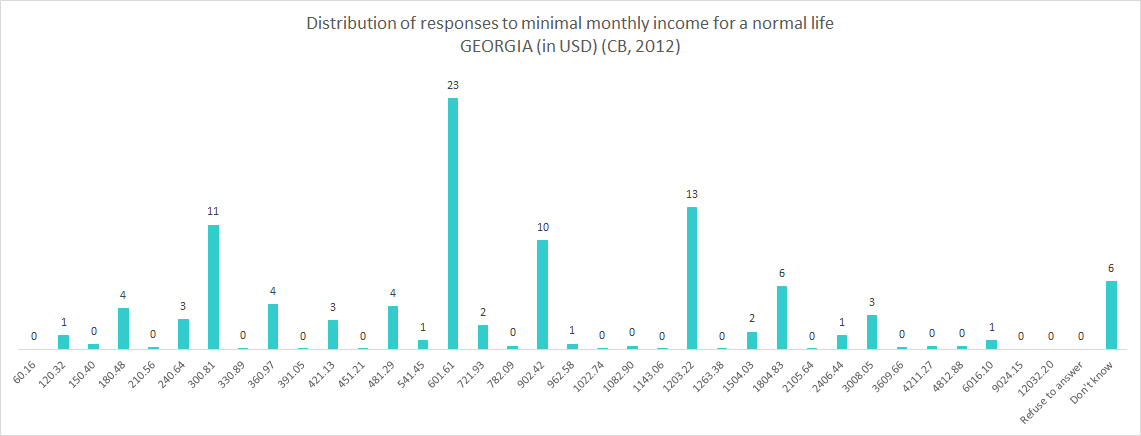
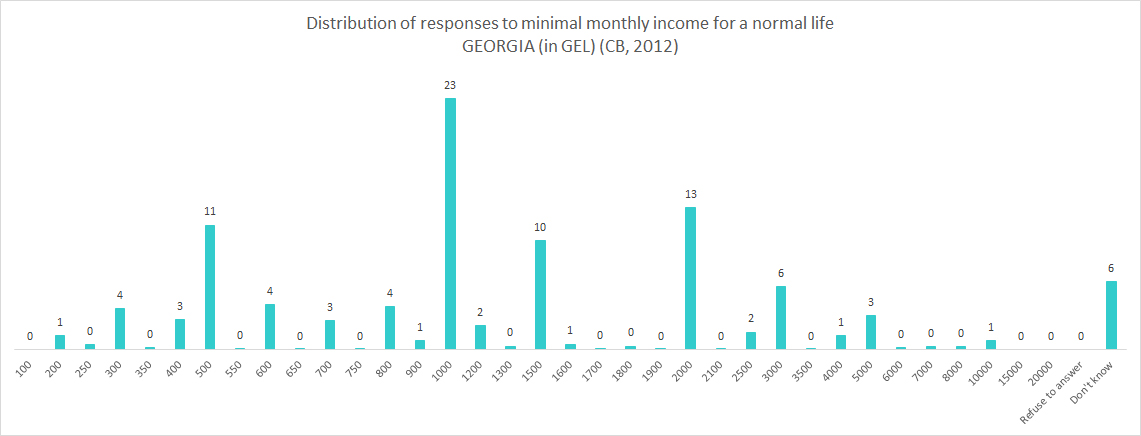
For Georgians, most said 1000 GEL (602 USD).

This confirms that a lot of people are just picking a round number. But still, it is interesting to look at.

INCOMEDIST

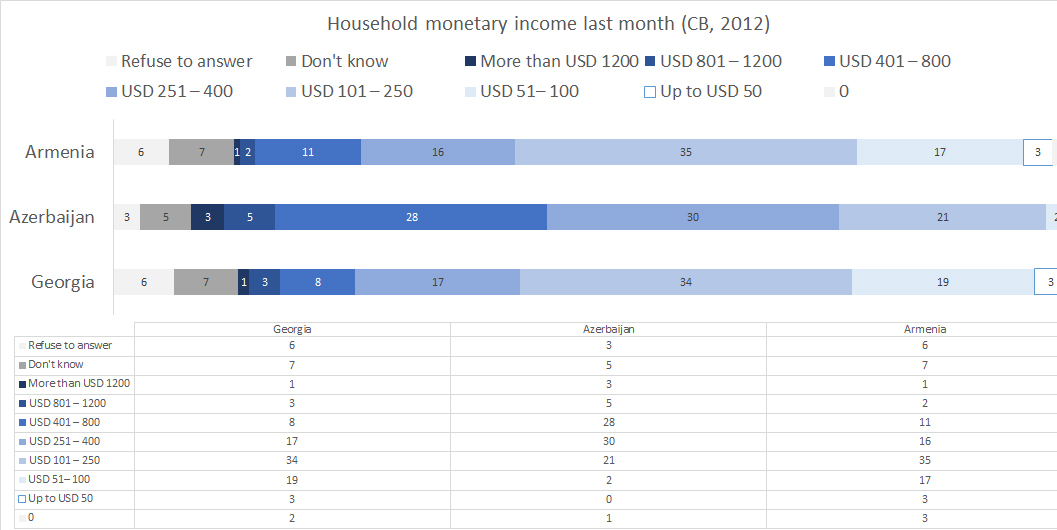
Ironically, when looking at the actual household monthly monetary income, very few South Caucasians are actually making as much as they say they need for a normal life. So does this mean that people strongly feel that they need more? I would assume. Or perhaps there are additional sources of income – remittances, borrowing, credit, etc. that are not factored in here. If less than 3% of Armenians are making as much as they said they need for a normal life, what kind of lives are people leading?

30 Dec

Trust and Gender in the Caucasus

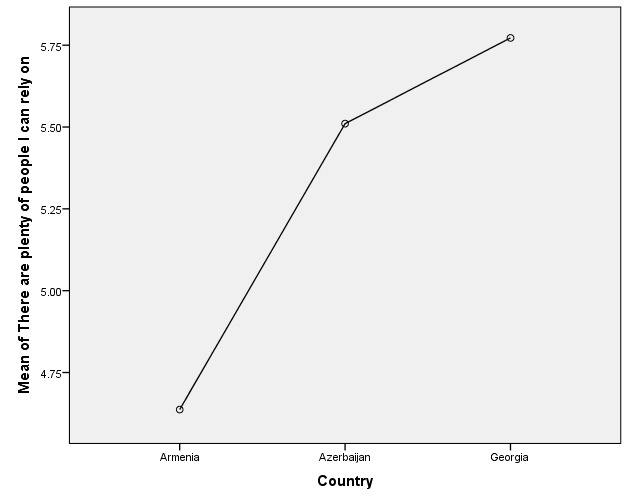
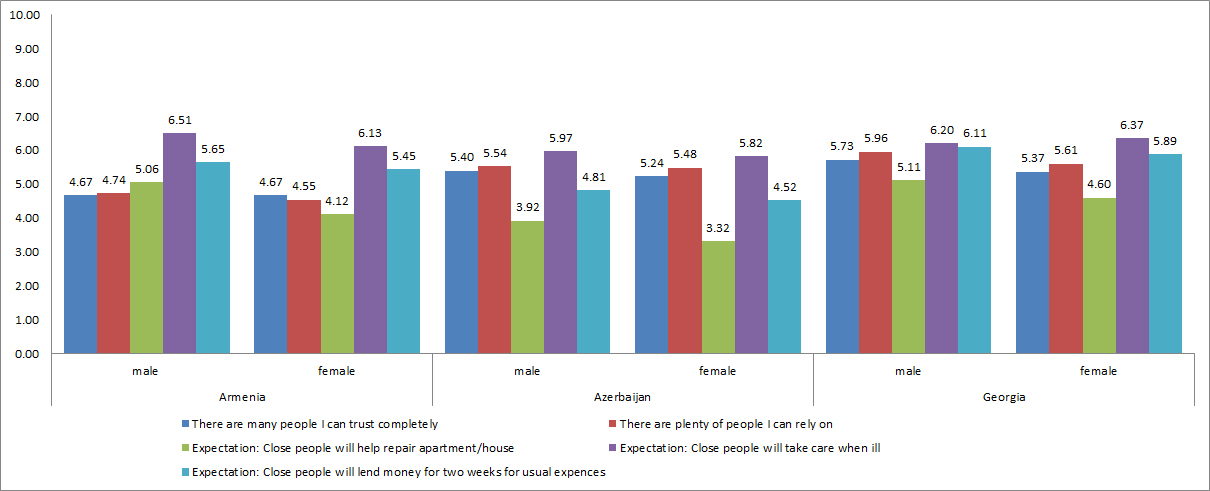
I wrote a blog post a few weeks ago about interpersonal trust (using EBRD data). One of my arguments is that Azerbaijanis have very low interpersonal trust. After a conversation with a girlfriend, I had the idea to look at gender differences in trust as well. This is with CRRC data.

First, without gender, you can see that generally Azerbaijanis have much lower trust in others than Armenians or Georgians do, but this varies by question. (These are on a 1-10 scale with 1 not trust, 10 trust completely or 1 total disagree and 10 totally agree).

f

e

d

b

a

In this next chart with gender, you can see gender differences in a variety of questions related to interpersonal trust. The only time that there was no significant difference in trust between men and women is for Armenians with the question “there are many people I can trust completely” – otherwise all these differences are significant.

gender1

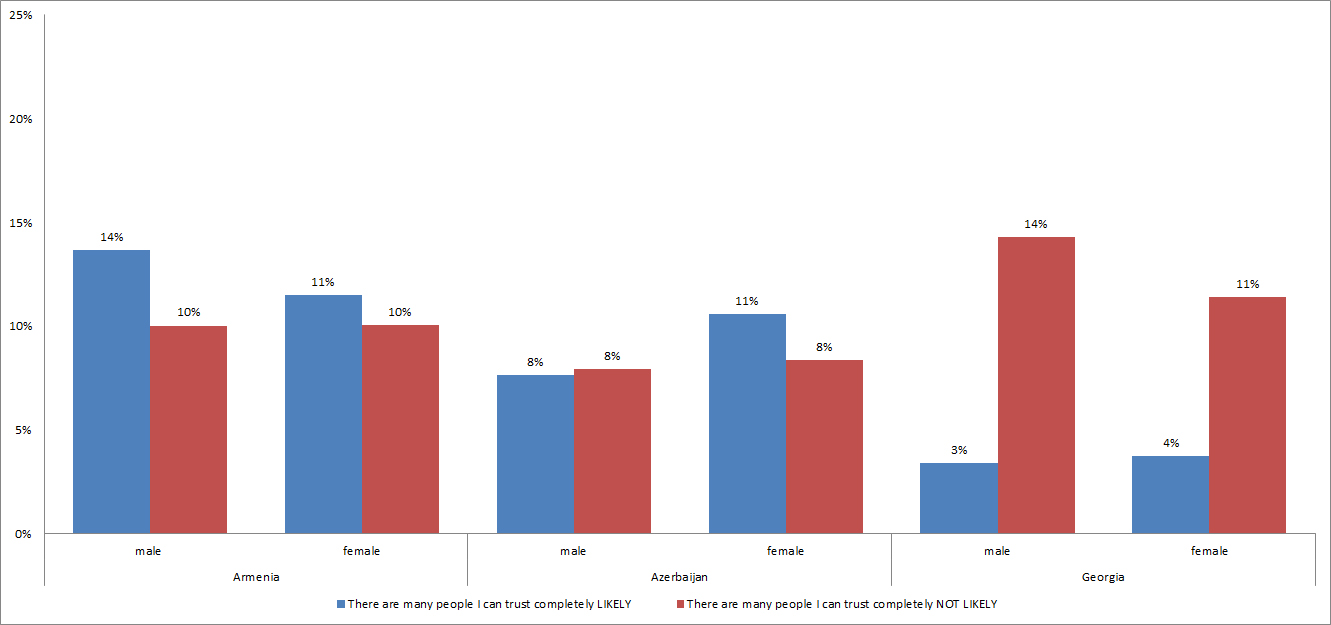
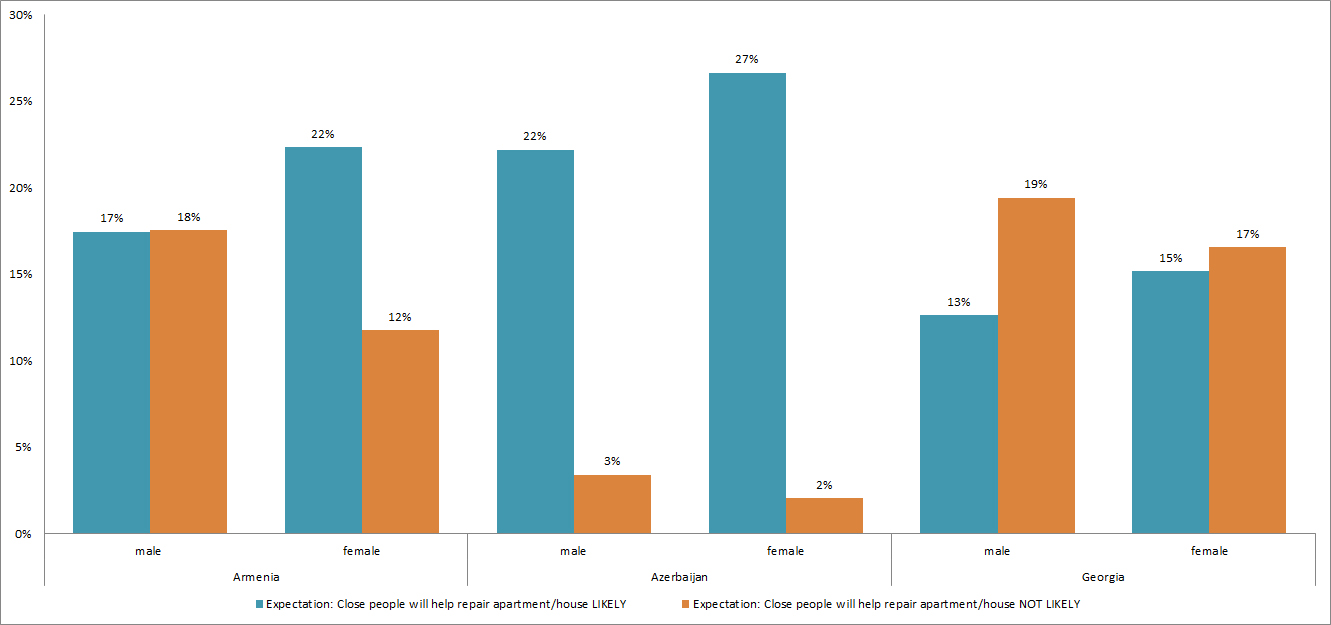
But looking at the two extremes – completely agree and completely disagree, things are also interesting…

v

In this question of people that one can trust completely, Georgians seem to have it the worst, with only 3 or 4% having someone like that. Overall gender differences aren’t that stark in this question.

w

Here for money lending, big country differences. Georgians can’t get a break, huh? Gender differences here exist, but not too harshly.

x

For reliable people, Georgians again are in a bad spot.

y

Help repair the apartment – well, this is a lot to ask of people, right? Georgians again are not doing well here.

z

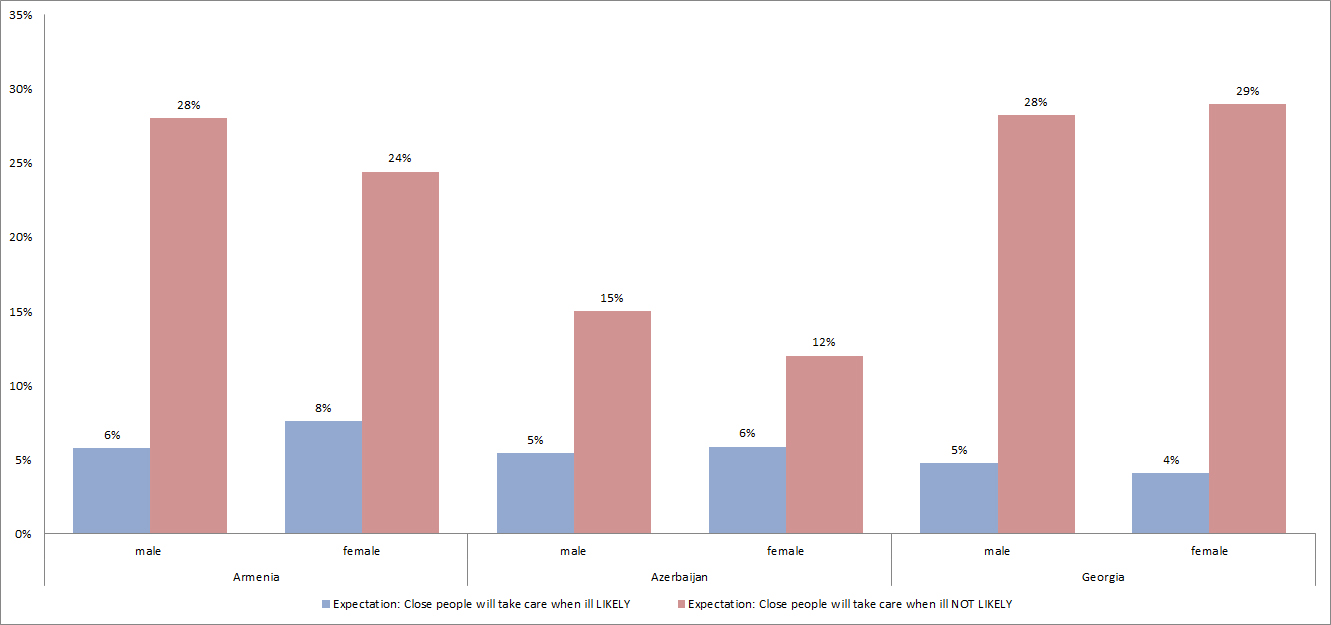
I don’t want to get sick in the Caucasus. Looks like people have trouble finding people to  help care for them. Again, no major gender differences here.

So overall, despite there being a statistically significant difference in trust between genders, it doesn’t really manifest in these practical questions.


30 Dec

Material Deprivation in 2012

A few years ago I wrote a piece about measuring poverty in the South Caucasus.

That paper ended with 2010, but I was talking about it with someone yesterday, so I did some quick 2012 updates.

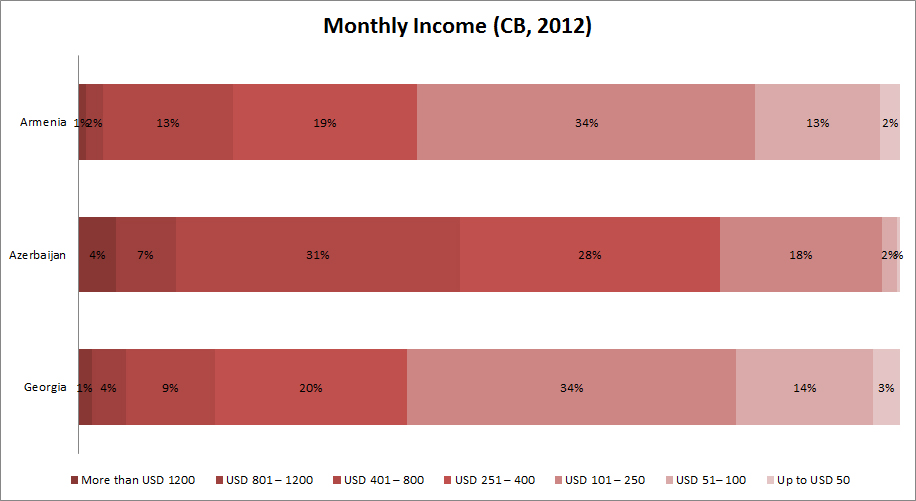
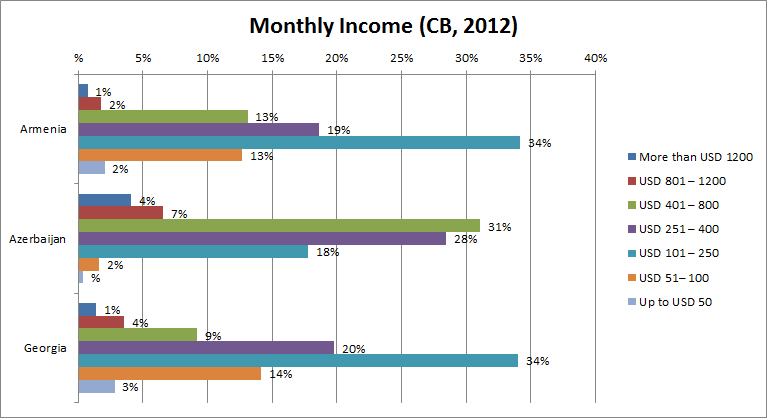
As far as monthly household income in 2012, the distribution hasn’t changed much since that 2010 paper, but you can see that Armenians and Azerbaijanis are doing much better economically.

income

income2

fig1

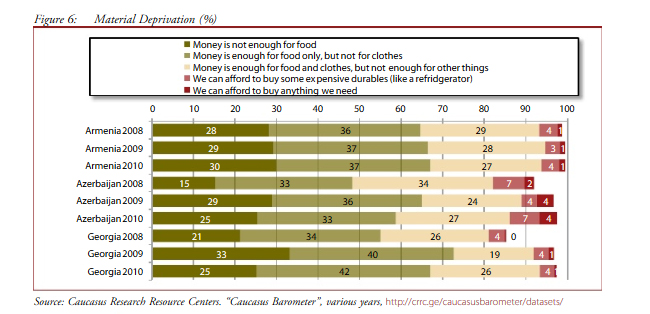
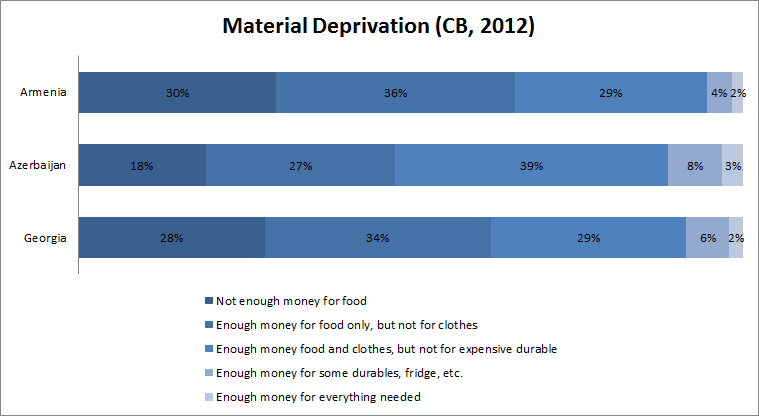
In the paper I argue that material deprivation is the best measure of economic wellbeing because it reflects household ability to buy consumer goods.

This is the 2009-2010 distribution of material deprivation:

mdold

And this is the 2012 update.

md

Armenia didn’t change much. Azerbaijan has less people at the poverty end of the scale, so that’s a positive change. Georgia had a bit of a change in more people in the enough for food category, but about the same in poorest category.


It is hard to see economic changes in such a short period of time – it would certainly be worthwhile to do some trend analysis here. Maybe next year!

19 Oct

Demand for Democracy in Europe and Eurasia

Demand for democracy is one of my favorite outcome (dependent) variables. It isn’t perfect, but it is used frequently in public opinion surveys and has been shown to be correlated with all sorts of interesting things.

In a transitional society, popular demand for democracy (or legitimation) takes the form of a choice between competing regime types with which people have some degree of familiarity. Thus, survey questions should preferably not ask people how much they like democracy in the abstract (for example, through agreement or disagreement with one-sided Likert scale statements). Instead, they should offer respondents realistic choices between democracy and its alternatives.” (from here)

“Which of these three statements is closest to your own opinion? (A) Democracy is preferable to any other form of government; (B) In certain situations, a nondemocratic government can be preferable; or (C) To people like me, it doesn’t matter what form of government we have.”

A study that I did with Erik Nisbet and Elizabeth Stoycheff found that: Internet use, but not national Internet penetration, is associated with greater citizen commitment to democratic governance. Furthermore, greater democratization and Internet penetration moderates the relationship between Internet use and demand for democracy.

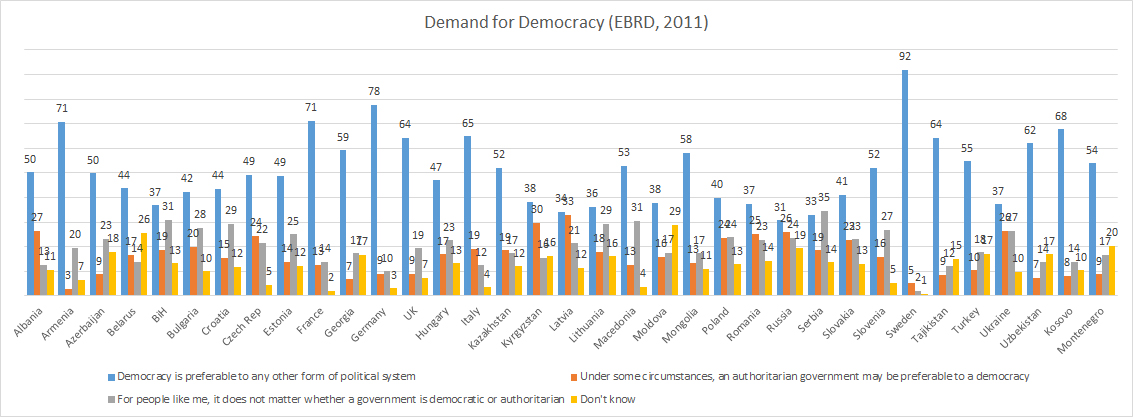
So, I was playing around with the EBRD Life in Transition II data today and did some graphics.

d4dall

Wow, Swedes love democracy.

d4deurasia

The variance in the former Soviet states is really interesting.

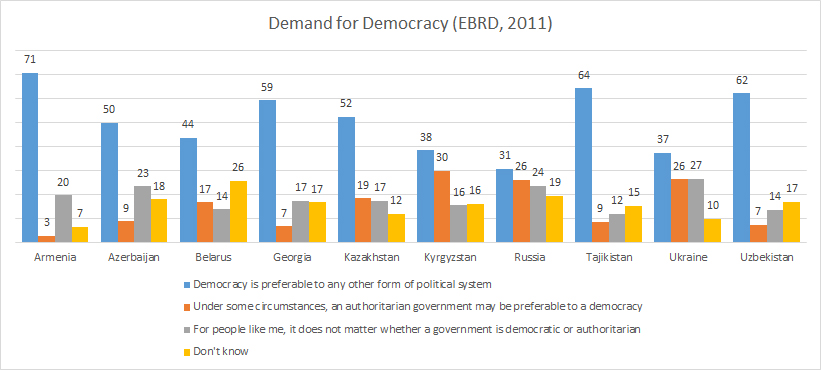
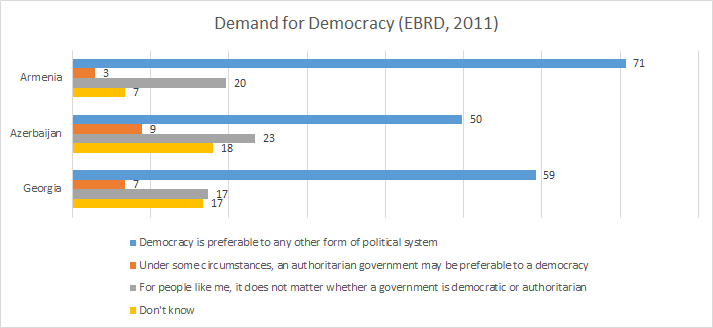
d4dcaucasus

And then we have the Caucasus. Looks like Armenians LOVE democracy.
Only half of Azerbaijanis prefer democracy.
Pretty high don’t knows in Azerbaijan and Georgia.